この記事ではCNNをTensorflow・kerasで構築していきます。CNNの概略については前回記事の
Tensorflow・kerasでCNNを構築して画像分類してみる(概要編)
で書いてきました。
今回はデータのダウンロードとデータの確認までを書きます。前提となる環境等は下記となります。
前提/環境
前提となる環境とバージョンは下記となります。
・Anaconda3
・Python3.7.7
・pip 20.0
・TensorFlow 2.0.0
この記事ではJupyter Notebookでプログラムを進めていきます。コードの部分をJupyter Notebookにコピー&ペーストし実行することで同様の結果が得られるようにしています。
今回はデータセットとしてCIFAR-10というデータセットを利用します。CIFAR-10のデータセットについては
The CIFAR-10 dataset を参照してください。
データのダウンロード
tensorflowではデータセットをMNIST同様に自動的にダウンロードします。
import tensorflow as tf
# ヘルパー関数などもimport
import numpy as np
import matplotlib.pyplot as plt

from tensorflow.keras.datasets import cifar10
(x_train, y_train), (x_test, y_test) = cifar10.load_data()
結果
Downloading data from https://www.cs.toronto.edu/~kriz/cifar-10-python.tar.gz
170500096/170498071 [==============================] - 951s 6us/step
データの確認
まずは各データの大きさの確認をします。データを確認するのは非常に重要なので必ず確認しましょう
print('x_train.shape : ', x_train.shape)
print('x_test.shape : ', x_test.shape)
print('y_train.shape : ', y_train.shape)
print('y_test.shape : ', y_test.shape)
結果
x_train.shape : (50000, 32, 32, 3)
x_test.shape : (10000, 32, 32, 3)
y_train.shape : (50000, 1)
y_test.shape : (10000, 1)
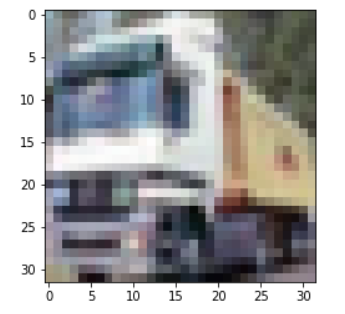
CIFAR-10データセットは上記のようなデータです。CIFAR-10データセットは60000枚の画像データセットです。訓練用データとして50000枚、評価用のデータとして10000枚からなります。ラベルについては10クラスに分類されています。airplane,automobile,bird,cat,dog,frog,horse,ship,truckの10種類です。画像は32×32×3のサイズです。縦32、横32、カラー画像なので色チャネルが3という形で表現されています。
では実際の画像を見てみましょう。
plt.imshow(x_train[1])
plt.grid(False)
plt.show()
shapeを見てみると32×32×3となっていますが、データ自体を見ましょう多次元の配列になっていることがわかります。
print(x_train[1])
結果 (一部抜粋)
[[[154 177 187]
[126 137 136]
[105 104 95]
...
[ 91 95 71]
[ 87 90 71]
[ 79 81 70]]
[[140 160 169]
[145 153 154]
[125 125 118]
...
[ 96 99 78]
[ 77 80 62]
[ 71 73 61]]
[[140 155 164]
[139 146 149]
[115 115 112]
...
というような行列になっています。
まとめ
ここまでデータを実際に確認しました。画像はMNISTの手書き文字セットと異なり、多次元の配列で表現されていることがわかりました。
データセットの構造を理解すると、処理のイメージもつきやすいとおもいます。
次回以降はデータの前処理、CNNの構築に入ります。
