matplotlibで3Dにプロットするための簡単なまとめ.
2変量正規分布の確率密度関数を3Dでプロットしてみる.
詳細は公式のtutorialを参照.
設定
とりあえず必要なものをimportする.
正規分布の次元数とパラメーターも設定しておく.
import matplotlib
print(matplotlib.__version__)
# 1.5.1

import numpy as np
from scipy.stats import multivariate_normal

# for plotting
import matplotlib.pyplot as plt
from mpl_toolkits.mplot3d import Axes3D

m = 2 #dimension
mean = np.zeros(m)
sigma = np.eye(m)
2018/4/17追加
最近のバージョン(ver2.2.2 stable version)でも大きな変更はなさそう.
詳細はここを参照.
The mplot3d Toolkit
各種プロット
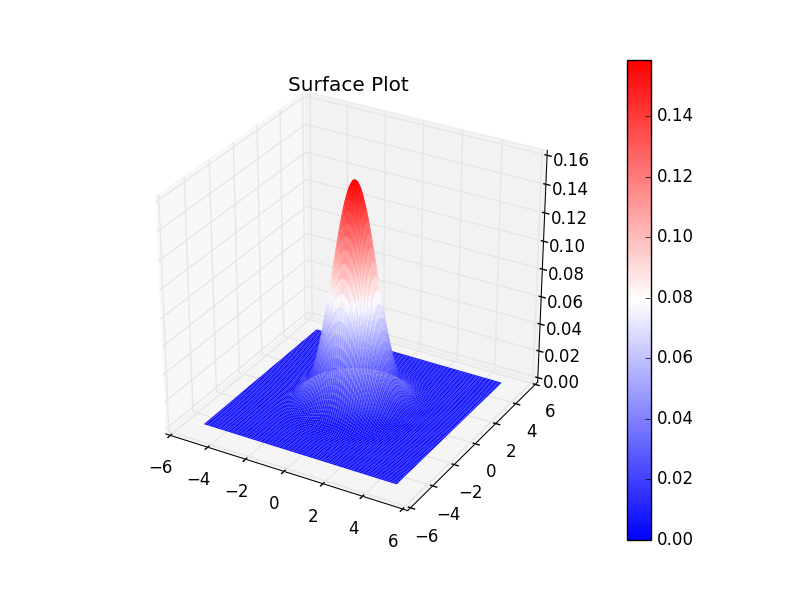
Surface Plot
Surface Plot(日本語でいうと表面プロット?)を試す.
注意点としては,plot_surface関数に渡すデータは,2次元配列になっているところ.
N = 1000
x1 = np.linspace(-5, 5, N)
x2 = np.linspace(-5, 5, N)

X1, X2 = np.meshgrid(x1, x2)
X = np.c_[np.ravel(X1), np.ravel(X2)]

Y_plot = multivariate_normal.pdf(x=X, mean=mean, cov=sigma)
Y_plot = Y_plot.reshape(X1.shape)

fig = plt.figure()
ax = fig.add_subplot(111, projection='3d')
surf = ax.plot_surface(X1, X2, Y_plot, cmap='bwr', linewidth=0)
fig.colorbar(surf)
ax.set_title("Surface Plot")
fig.show()

# X1.shape : (1000, 1000)
# X2.shape : (1000, 1000)
# Y_plot.shape : (1000, 1000)
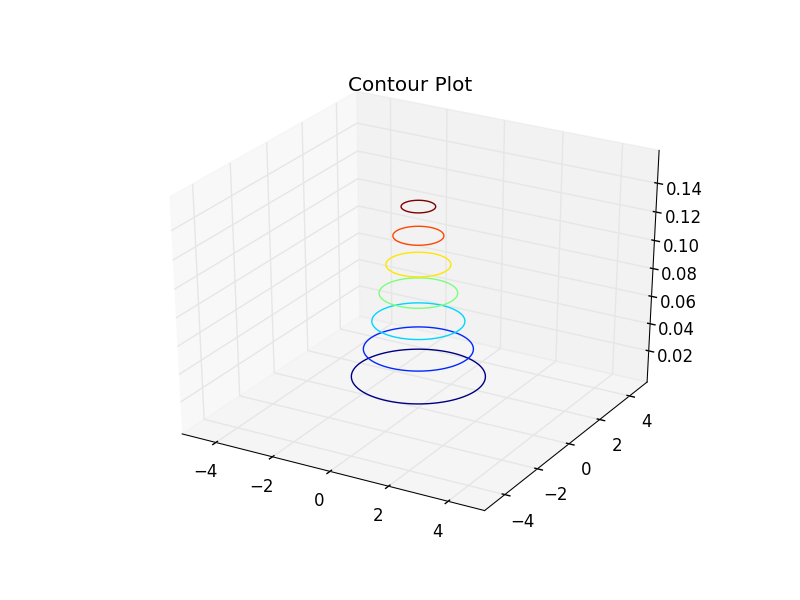
Contour Plot
Contour Plot(等高線プロット)もsurface plotと同じようにできる.
N = 1000
x1 = np.linspace(-5, 5, N)
x2 = np.linspace(-5, 5, N)

X1, X2 = np.meshgrid(x1, x2)
X = np.c_[np.ravel(X1), np.ravel(X2)]
Y_plot = multivariate_normal.pdf(x=X, mean=mean, cov=sigma)
Y_plot = Y_plot.reshape(X1.shape)

fig = plt.figure()
ax = fig.add_subplot(111, projection='3d')
ax.contour(X1, X2, Y_plot)
ax.set_title("Contour Plot")
fig.show()

# X1.shape : (1000, 1000)
# X2.shape : (1000, 1000)
# Y_plot.shape : (1000, 1000)
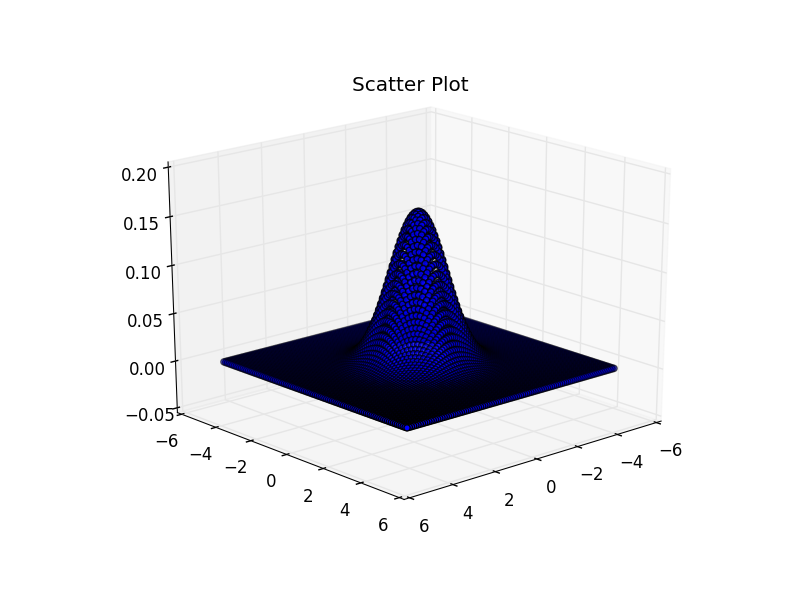
Scatter Plot
今までとは異なり,scatter plot(散布図)に渡すデータは1次元配列である.
N = 100
x1 = np.linspace(-5, 5, N)
x2 = np.linspace(-5, 5, N)

X1, X2 = np.meshgrid(x1, x2)
X_plot = np.c_[np.ravel(X1), np.ravel(X2)]

y = multivariate_normal.pdf(X_plot, mean=mean, cov=sigma)

fig = plt.figure()
ax = fig.add_subplot(111, projection='3d')
ax.scatter3D(np.ravel(X1), np.ravel(X2), y)
ax.set_title("Scatter Plot")
plt.show()

# np.ravel(X1).shape : (10000,)
# np.ravel(X2).shape : (10000,)
# y.shape : (10000,)
scatter plotはこういう関数の形をみたいとき向けではないので,見にくいのはしょうがない.
Axes3Dについて
他の記事をみていると3D用のaxオブジェクトは以下のように作っている例もあるが,
import matplotlib.pyplot as plt
from mpl_toolkits.mplot3d import Axes3D

fig = plt.figure()
ax = Axes3D(fig)
# <class 'mpl_toolkits.mplot3d.axes3d.Axes3D'>
最近のversionではtutorialの通りこっちを使うのが推奨らしい.
import matplotlib.pyplot as plt
from mpl_toolkits.mplot3d import Axes3D

fig = plt.figure()
ax = fig.add_subplot(111, projection='3d')
# <class 'matplotlib.axes._subplots.Axes3DSubplot'>
ちなみにAxes3Dは明示的に使用していないが,importしておかないとKeyError: '3d'がでる.
また,同じクラスのaxオブジェクトを以下のようにも作れるようだ.
fig = plt.figure()
ax = fig.gca(projection='3d')
# <class 'matplotlib.axes._subplots.Axes3DSubplot'>
その他
pythonでいい感じに3Dプロットしてくれるplotlyというのもあるらしいのでそのうち調べたい.


