起動
docker-composeでかんたん実行。
docker-compose up
docker-compose.yml
version: '3.1'

services:
  prometheus:
    image: prom/prometheus
    container_name: prometheus
    ports:
      - 9090:9090
    networks:
      - public
    volumes:
      - ./prometheus/prometheus.yml:/etc/prometheus/prometheus.yml

  pushgateway:
    image: prom/pushgateway
    container_name: pushgateway
    ports:
      - 9091:9091
    networks:
      - public

  grafana:
    image: kannkyo/grafana
    container_name: grafana
    ports:
      - 3000:3000
    networks:
      - public

networks:
  public:
./prometheus/prometheus.yml
scrape_configs:
  - job_name: 'pushgateway'
    scrape_interval: 1s
    static_configs:
      - targets: ['pushgateway:9091']
        labels:
          environment: "hoge"
          category: "pushgateway"
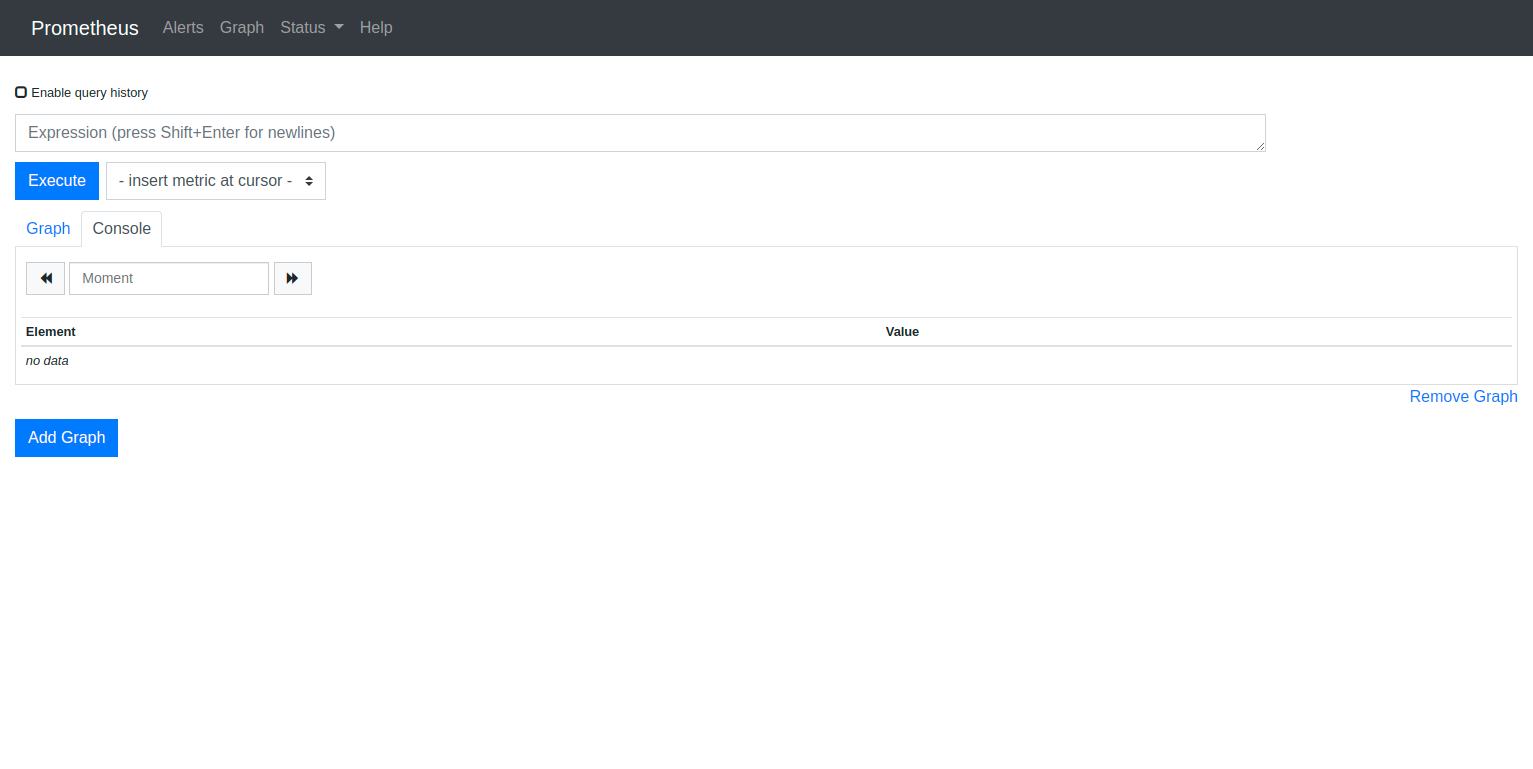
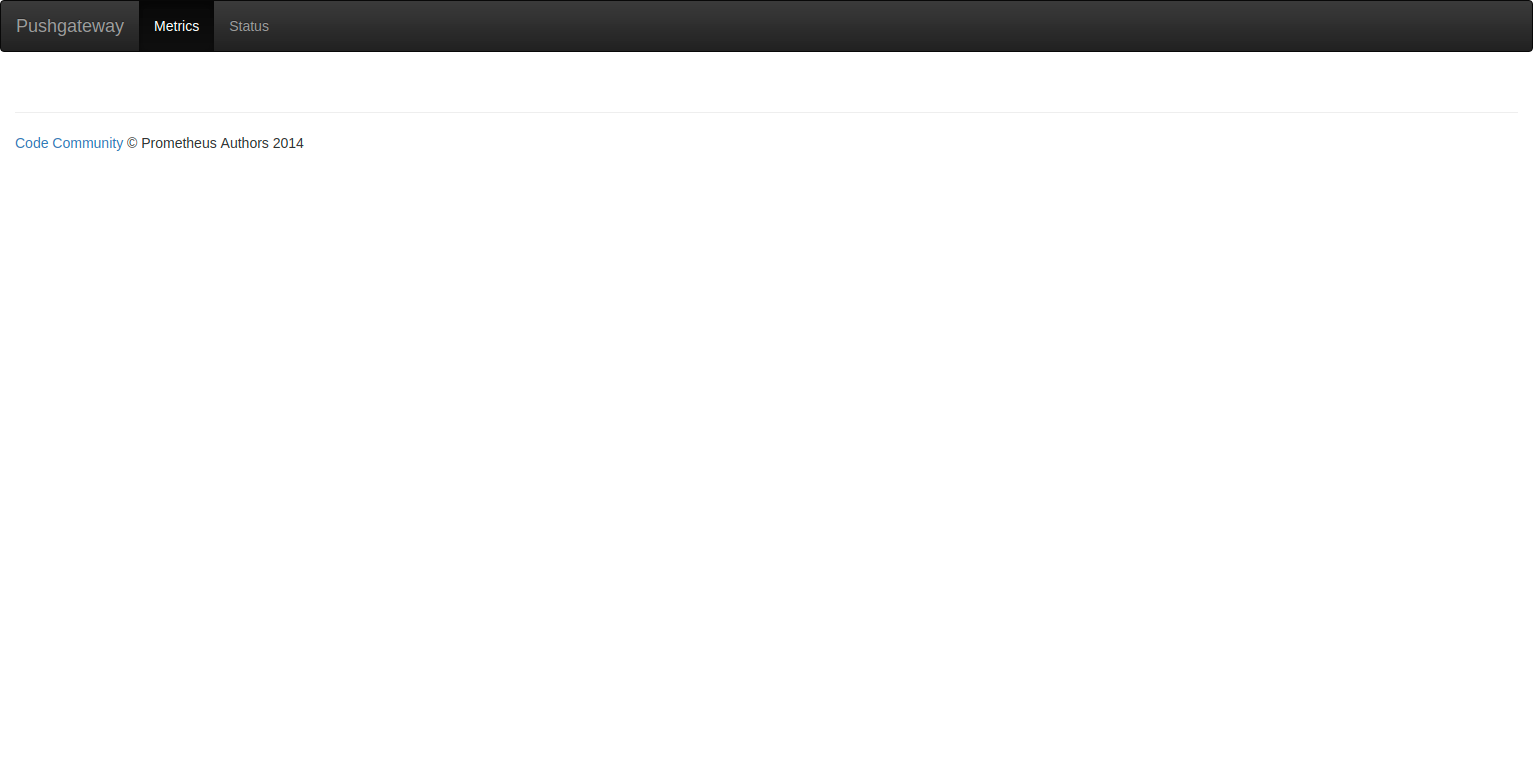
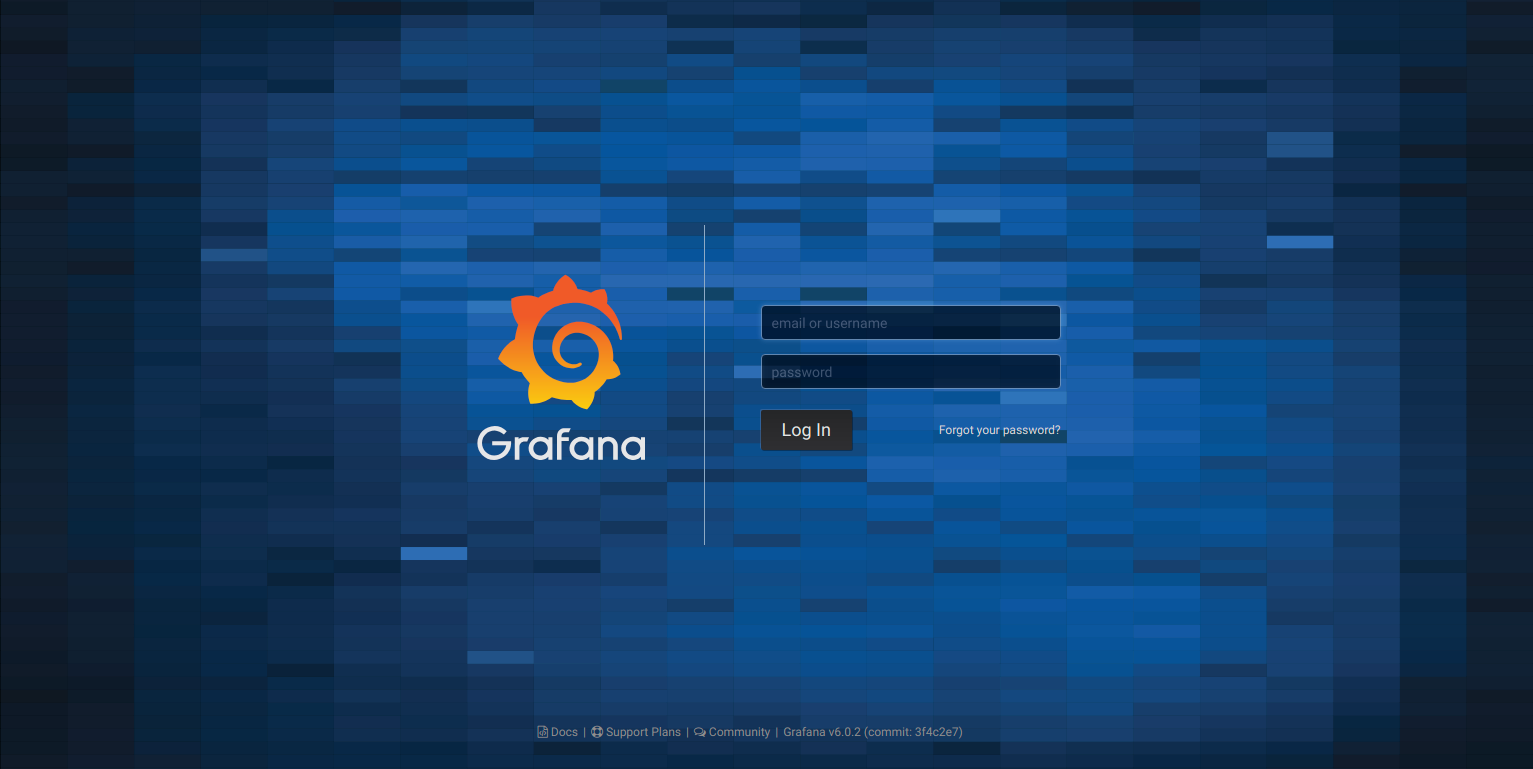
表示
prometheus
pushgateway
grafana
メトリクスを操作する
docker-compose.yml のnetworksの設定により、pushgateway -> prometheus -> grafana にメトリクスを送信できるようになっている。
以下のスクリプトでメトリクスをプッシュしたりクリアしたりできる。
メトリクスをプッシュする
push.sh
# !/bin/bash

JOB=pushgateway

MAX_VAL=100
DATA=$(($RANDOM % $MAX_VAL))
METRICS="some_metric $DATA"

echo $METRICS
echo $METRICS | curl --data-binary @- http://localhost:9091/metrics/job/$JOB
メトリクスをクリアする
clear.sh
# !/bin/bash

JOB=pushgateway
curl -X DELETE http://localhost:9091/metrics/job/$JOB