この記事で行うこと
この記事の続編です→「matplotlibでヒストグラムの縦軸を相対度数(柱の高さの合計=1)や相対度数密度(ヒストグラム全体の面積=1)にする」
matplotlibで、ヒストグラムを
- 左側の縦軸を度数(matplotlibのデフォルト)
- 右側の縦軸を相対度数(柱の高さの合計=1)
にして描画します。ただし、邪道なやり方かもしれません。
参考ページ(感謝します)
[python]matplotlibで左右に2つの軸があるグラフを書く方法
ソースコード(Jupyter Notebook)と描画結果
データ件数は7500件で、平均値50、標準偏差10の正規乱数にしました。
まず以下のPythonコードを実行してみます。
# %%

import numpy as np
import matplotlib.pyplot as plt


# %%

# データ作成
μ = 50
σ = 10
data = [ np.random.normal(μ, σ) for i in range(7500) ]


# %%

# 階級数
num_bins = 20

# グラフ描画
fig = plt.figure(figsize=(12, 8))
plt.legend()
plt.xlabel('x', fontsize=18)
plt.title('null', fontsize=18)

# (1) 縦軸を度数にしたヒストグラム
ax1 = fig.add_subplot(111)
ax1.set_ylabel('frequency', fontsize=18)
ax1.grid(True, color="dimgray")
ax1.set_axisbelow(True)    # gridを最背面に移動
ax1.hist(data, bins=num_bins, rwidth=0.5, align="mid")

# (2) 縦軸を相対度数にしたヒストグラム
ax2 = ax1.twinx()
ax2.set_ylabel('relative frequency', fontsize=18)
ax2.grid(True, color="lightgrey", linestyle="--")
ax2.set_axisbelow(True)    # gridを最背面に移動
weights = np.ones_like(data) / len(data)
ax2.hist(data, bins=num_bins, weights=weights, rwidth=0.5, align="right", color="red")
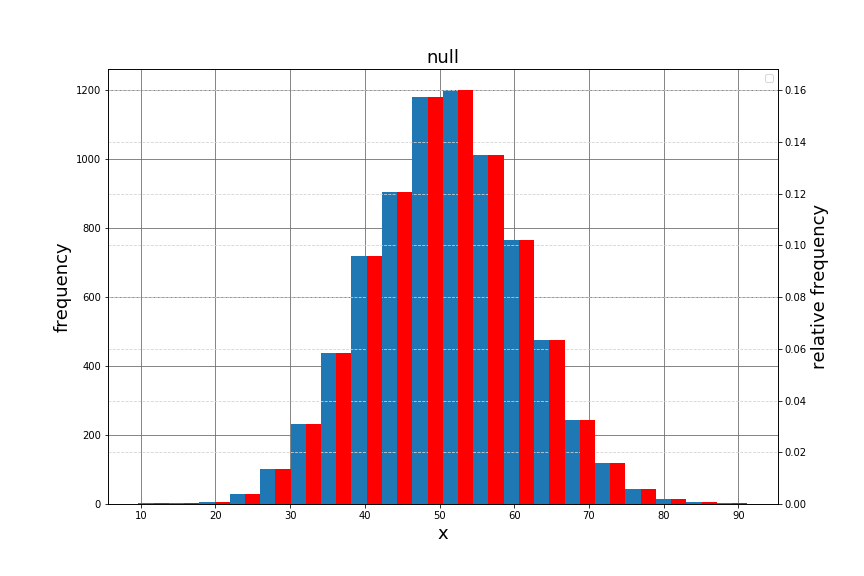
縦軸=度数の柱をデフォルトの色で、縦軸=相対度数の柱を赤で、左右に並べて描画しました。
この両者の高さが同じに見えることを人が確認します(邪道たる所以..)
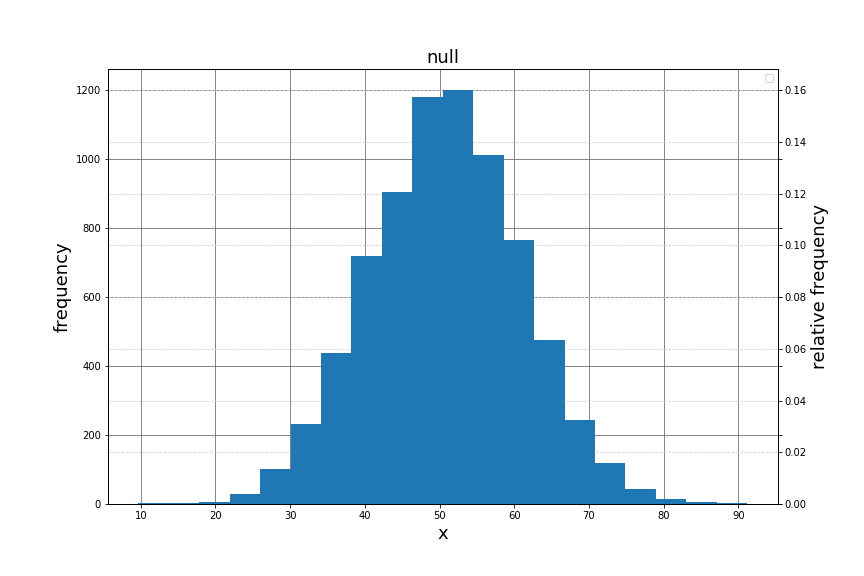
度数と相対度数の柱の高さが同じに見えたら、柱の色を一致させます。
「color="red"」を指定せずに、ax2.hist()を呼び出します。
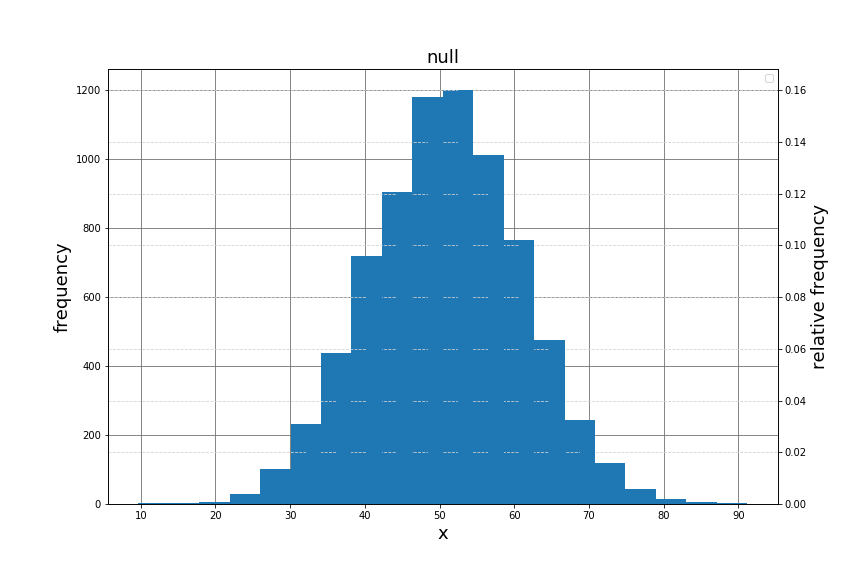
ax2のGrid線が、ax1の柱より手前に表示されてしまいました。
この横線を見えなくするために、以下のコードを追加してax1と同じグラフを上書き描画することにしました。
# (3) (1)の見栄えを調整
ax3 = ax1.twinx()
ax3.set_yticklabels([])
ax3.hist(data, bins=num_bins, rwidth=0.5, align="mid")
完成版のコード全体は以下の通りです。
# %%

import numpy as np
import matplotlib.pyplot as plt


# %%

# データ作成
μ = 50
σ = 10
data = [ np.random.normal(μ, σ) for i in range(7500) ]


# %%

# 階級数
num_bins = 20

# グラフ描画
fig = plt.figure(figsize=(12, 8))
plt.legend()
plt.xlabel('x', fontsize=18)
plt.title('null', fontsize=18)

# (1) 縦軸を度数にしたヒストグラム
ax1 = fig.add_subplot(111)
ax1.set_ylabel('frequency', fontsize=18)
ax1.grid(True, color="dimgray")
ax1.set_axisbelow(True)    # gridを最背面に移動
ax1.hist(data, bins=num_bins, rwidth=0.5, align="mid")

# (2) 縦軸を相対度数にしたヒストグラム
ax2 = ax1.twinx()
ax2.set_ylabel('relative frequency', fontsize=18)
ax2.grid(True, color="lightgrey", linestyle="--")
ax2.set_axisbelow(True)    # gridを最背面に移動
weights = np.ones_like(data) / len(data)
ax2.hist(data, bins=num_bins, weights=weights, rwidth=0.5, align="right")

# (3) (1)の見栄えを調整
ax3 = ax1.twinx()
ax3.set_yticklabels([])
ax3.hist(data, bins=num_bins, rwidth=0.5, align="mid")
邪道な感じなので、正攻法があれば教えてほしいです。


