これは何の記事?
ELO MERCHANT CATEGORY RECOMMENDATIONコンペの学習ログです
まずは探索的データ分析(EDA)を行います
環境
Google Colab
記事の流れ
- データの読み込み
- データの概要把握
- 1. trainデータ
データの読み込み
データが重すぎて読み込めない(エラーが起きる)
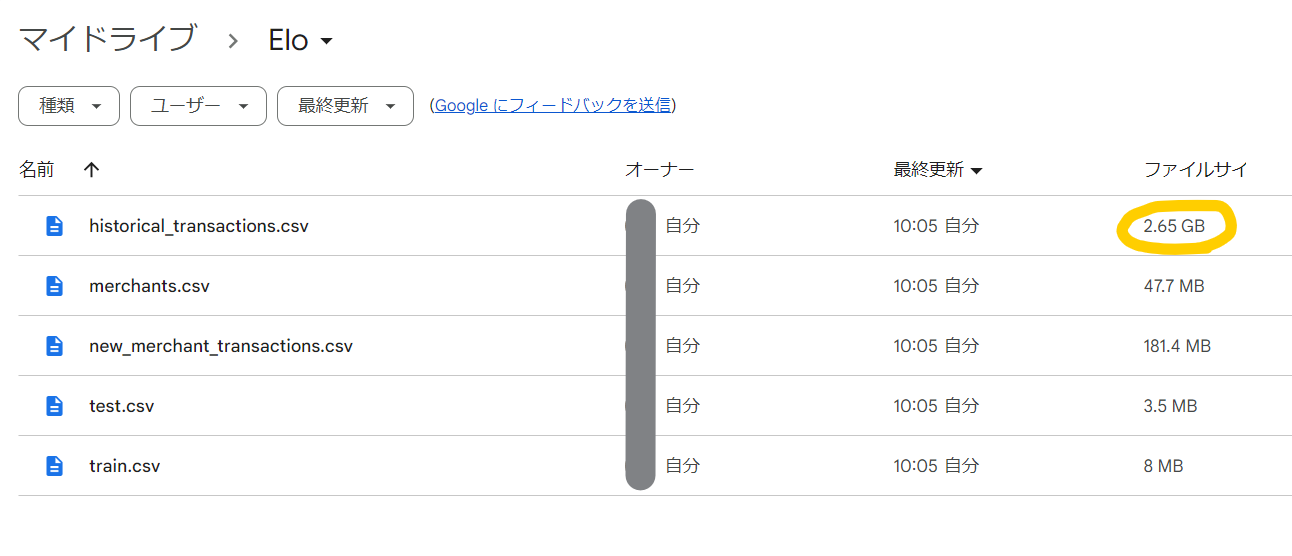
以下の方法で何とか読み込めたが、他の良い方法を知りたい…
# ドライブをマウント
from google.colab import drive
drive.mount('/content/drive')

# 使用するライブラリをインポート
import pandas as pd
import numpy as np

# 訓練データの読み込み
train_df = pd.read_csv("/content/drive/MyDrive/Elo/train.csv")
test_df = pd.read_csv("/content/drive/MyDrive/Elo/test.csv")

# 1000行ずつに区切って結合する
historical_reader = pd.read_csv("/content/drive/MyDrive/Elo/historical_transactions.csv", chunksize=1000)
historical_df = pd.concat((r for r in historical_reader), ignore_index=True)
new_merchant_df = pd.read_csv("/content/drive/MyDrive/Elo/new_merchant_transactions.csv")
merchant_df = pd.read_csv("/content/drive/MyDrive/Elo/merchants.csv")

# 3分20秒かかった
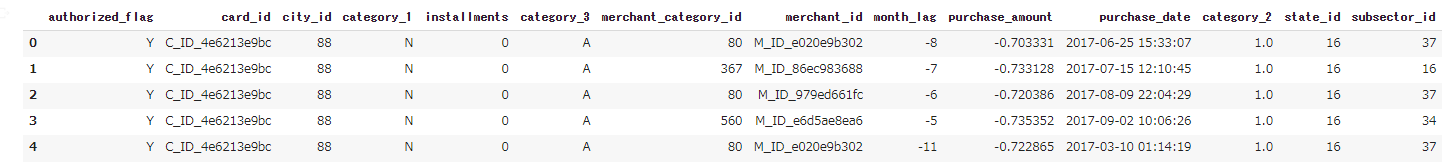
データの概要把握
historical_df.head(5)
探索的データ分析(EDA)
1. trainデータ
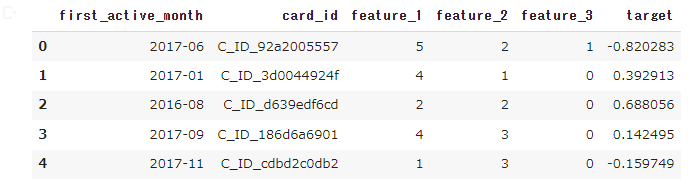
feature_1~3はEloによってマスキングされた特徴量
| Columns | Description |
|---|---|
| card_id | Unique card identifier |
| first_active_month | 初回購入月 |
| feature_1 | 特徴量1 |
| feature_2 | 特徴量2 |
| feature_3 | 特徴量3 |
| target | Loyalty score(評価期間の2か月後に算出されるらしい) |
train_df.head()
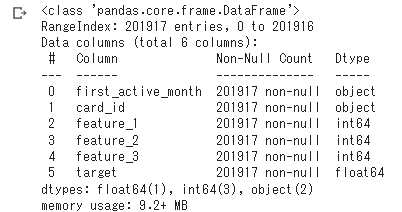
欠損値はない
train_df.info()
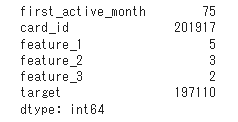
カードIDに重複なし
print(train_df.nunique())
targetの分布を確認、異常値(?)に注意
# 使用するライブラリをインポート
import matplotlib.pyplot as plt
import seaborn as sns

# targetのヒストグラムを作る
plt.figure(figsize=(10,4))
plt.hist(train_df["target"], bins=50)
plt.title('Histgram of Target')
plt.xlabel("target")
plt.ylabel("count")
plt.show()
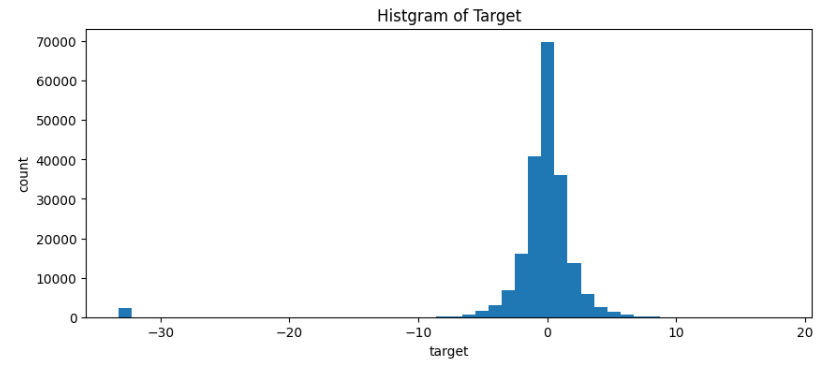
-30周辺のtargetは9σ離れており、異常値として削除してもよさそう
※targetは正規分布として
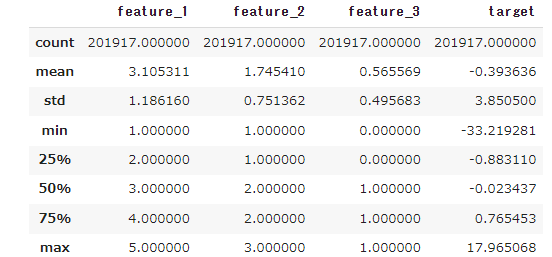
train_df.describe()
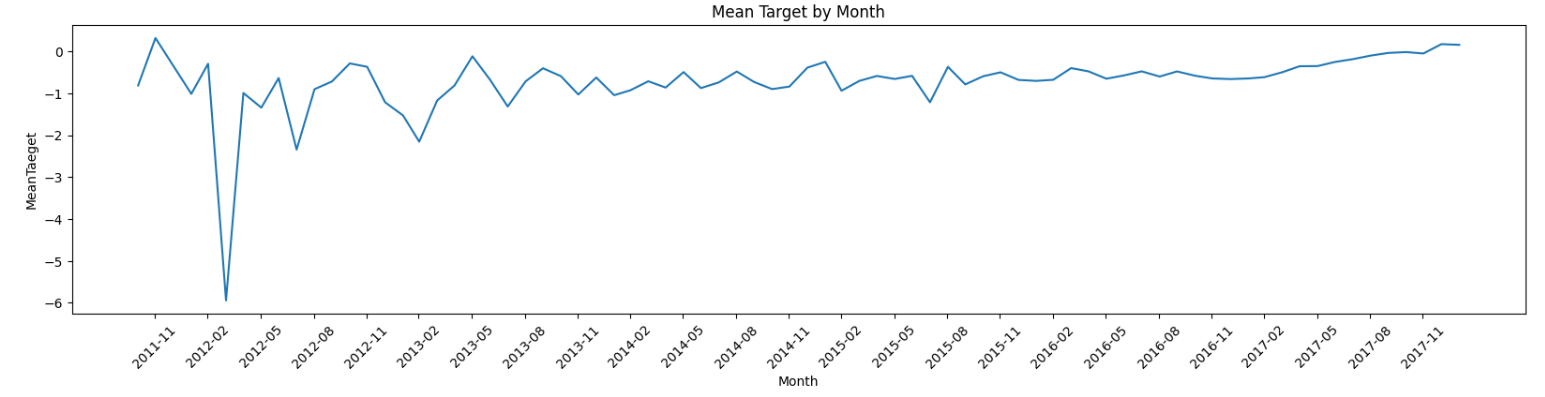
上昇傾向?2012年2月~5月間に異常値が集結している模様
# first_active_monthをdatetime方にしたdfを用意
# 可視化した際、x軸のmonthの表示間隔を調整できるため。object型だとドリルアップできない。
train_df_term = train_df.copy()
train_df_term["first_active_month"] = pd.to_datetime(train_df_term["first_active_month"])

# first_active_monthはobjectタイプである
mean_target_per_month = train_df_term[["first_active_month", "target"]].groupby("first_active_month").mean().reset_index()
mean_target_per_month.columns = ["first_active_month", "mean_target"]

# 可視化
plt.figure(figsize=(20,4))
plt.plot(mean_target_per_month["first_active_month"], mean_target_per_month["mean_target"])
plt.title('Mean Target by Month')
plt.xlabel('Month')
plt.ylabel('MeanTaeget')
x_ticks = pd.date_range(start='2011-11', end='2018-02', freq='3M')
plt.xticks(x_ticks, [date.strftime('%Y-%m') for date in x_ticks])
plt.xticks(rotation=45)
plt.show()
相関行列を確認
# 相関行列を作成
train_corr = train_df.corr()

train_corr
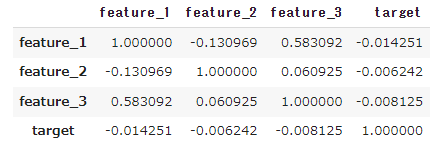
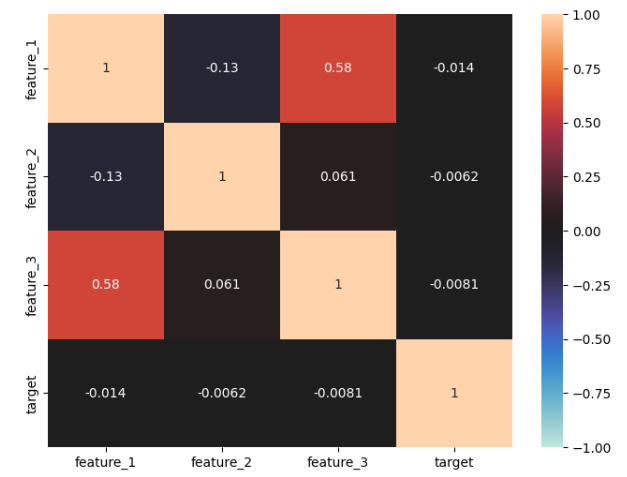
feature_1 と feature_3 に正の相関がみられる。どれもtargetとの相関はなし
# ヒートマップ作成
plt.figure(figsize=(8,6))
sns.heatmap(train_corr, vmax=1, vmin=-1, center=0, annot=True)
plt.show()
~part2に続く~