経緯
なんやかんやで機械学習をしなくてはいけなくなったため、やってみたものの奥深いっていうか、ごちゃごちゃしてきたためまとめてみた。
英語のドキュメントを読むこと多いから、英単語も載せていくよ
知識レベル
取り敢えず、この記事は確率統計およびDeep Learningの基本的な知識があるものとして話を進める。Deep Learningについての知識は下の本を読んで理解していればいいかな。この本はすごくわかりやすいのでおすすめ。
[ゼロから作るDeep Learning ―Pythonで学ぶディープラーニングの理論と実装]
(https://www.amazon.co.jp/ゼロから作るDeep-Learning-―Pythonで学ぶディープラーニングの理論と実装-斎藤-康毅/dp/4873117585)
環境
macOS Mojave
Python 3.6.2
pip3 10.0.1
正規分布(normal distribution)
random_normal
tf.random_normal(
    shape,
    mean=0.0,
    stddev=1.0,
    dtype=tf.float32,
    seed=None,
    name=None
)
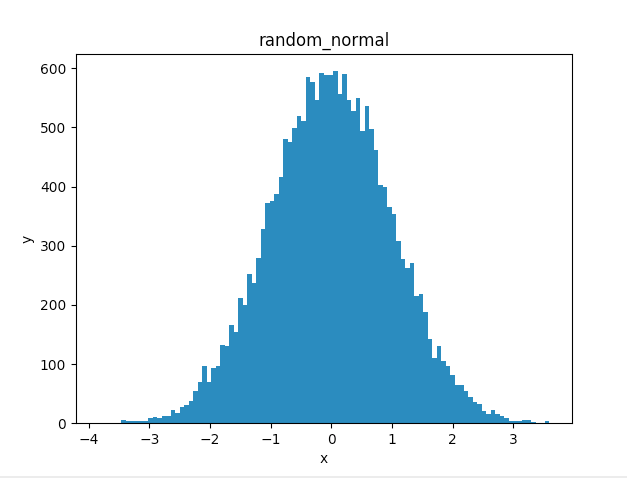
正規分布から乱数を出力する
大体名前から引数の意味はわかると思うので省略する。seedは話が長くなりそうだから他の記事で書くかも...
使用例
# -*- coding:utf-8 -*-
# !/usr/bin/env python3

import tensorflow as tf
import numpy as np
import matplotlib.pyplot as plt

sess = tf.InteractiveSession()
x = sess.run(tf.random_normal(shape=[20000],mean=0.0,stddev=1.0,dtype=tf.float32))
fig = plt.figure()

ax = fig.add_subplot(1,1,1)
ax.hist(x,bins=100)
ax.set_title('random_normal')
ax.set_xlabel('x')
ax.set_ylabel('y')

plt.show()
truncated_normal
tf.truncated_normal(
    shape,
    mean=0.0,
    stddev=1.0,
    dtype=tf.float32,
    seed=None,
    name=None
)
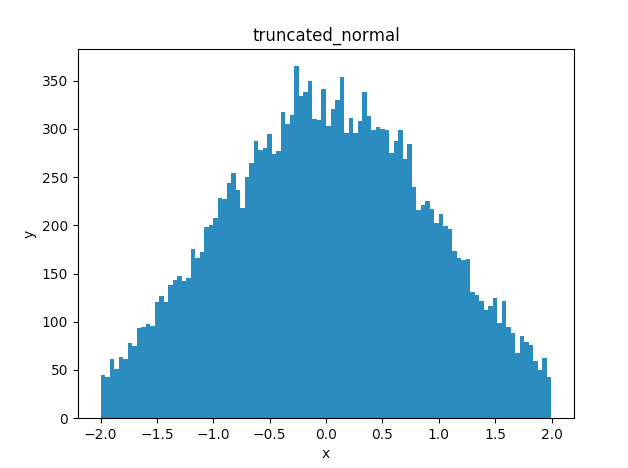
切断正規分布から乱数を出力する
標準偏差の2倍までを出力
使用例
# -*- coding:utf-8 -*-
# !/usr/bin/env python3

import tensorflow as tf
import numpy as np
import matplotlib.pyplot as plt

sess = tf.InteractiveSession()
x = sess.run(tf.truncated_normal(shape=[20000],mean=0.0,stddev=1.0,dtype=tf.float32))
fig = plt.figure()

ax = fig.add_subplot(1,1,1)
ax.hist(x,bins=100)
ax.set_title('truncated_normal')
ax.set_xlabel('x')
ax.set_ylabel('y')

plt.show()
random_uniform
tf.random_uniform(
    shape,
    minval=0,
    maxval=None,
    dtype=tf.float32,
    seed=None,
    name=None
)
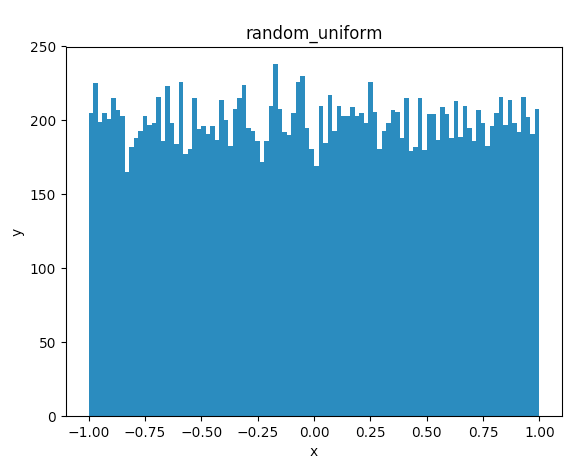
一様分布から乱数を出力する
使用例
# -*- coding:utf-8 -*-
# !/usr/bin/env python3

import tensorflow as tf
import numpy as np
import matplotlib.pyplot as plt

sess = tf.InteractiveSession()
x = sess.run(tf.random_uniform(shape=[20000],minval=-1.0,maxval=1.0,dtype=tf.float32))
fig = plt.figure()

ax = fig.add_subplot(1,1,1)
ax.hist(x,bins=100)
ax.set_title('random_uniform')
ax.set_xlabel('x')
ax.set_ylabel('y')

plt.show()
matplotlibの解説を少し
plt.figure()
これで何も描かれていないウィンドウを作成。
add_subplot(nrows, ncols, index, **kwargs)
戻り値 : Axesのサブクラス
index : その図の場所
nrows = 2 , ncols = 3 の時
| 1 | 2 | 3 |
|---|---|---|
| 4 | 5 | 6 |
hist(x,bins=100)
ヒストグラムを作成。
bins : 棒の本数
詳しい説明はこちら
InteractiveSession()とSession()の違い
random_uniformは次のようにして実装することも出来る
使用例
# -*- coding:utf-8 -*-
# !/usr/bin/env python3

import tensorflow as tf
import numpy as np
import matplotlib.pyplot as plt


x = tf.random_uniform(shape=[20000],minval=-1.0,maxval=1.0,dtype=tf.float32)
fig = plt.figure()
ax = fig.add_subplot(1,1,1)
with tf.Session() as sess:
    y = x.eval()

ax.hist(y,bins=100)
ax.set_title('random_uniform')
ax.set_xlabel('x')
ax.set_ylabel('y')

plt.show()
さっきと違ってrun()がeval() InteractiveSession()がSessionになってる。
結論から言うと、どちらも同じ。
このサイト様が詳しく説明してくれてる。とても参考になりました。
Tensorflow run() vs eval() と InteractiveSession() vs Session()
英単語
| 英語 | 日本語 |
|---|---|
| normal distribution | 正規分布 |
| mean | 平均 |
| standard deviation | 標準偏差 |