この記事は IBM Cloud Advent Calendar 2020 の 17 日目の記事です。
https://qiita.com/y_tama/items/60def40b948fa2e11a79
がベースとなっていますが、OS再起動やサインアウトしてしまうとコマンドプロンプトが停止してしまい、データが送信できなくなります。
https://cloud.ibm.com/docs/Monitoring-with-Sysdig?topic=Monitoring-with-Sysdig-windows&locale=en
にwmi_exporterのダウンロードリンクが記載されています。
最新版をインストールしたいところですが、0.13.0 より、メトリックのプレフィックスが wmi_ から windows_ に変更になっています。
This is the last planned release with the wmi_exporter name, future releases will be named windows_exporter. See #499 and #519 for context.
This includes changing the metrics' name prefixes from wmi_ to windows_, meaning that all queries need to be changed to match the new names.
For example, windows_cpu_time_total replaces wmi_cpu_time_total.
(Deprecation noteより)
IBMCloud では プレフィックス wmi_ を想定しているようで、0.12.0までしかデータを取得することができませんでした。
https://github.com/prometheus-community/windows_exporter/releases/tag/v0.12.0
から msi 版をダウンロードします。
msi 版をダウンロードし、ダブルクリックして導入すればサービス登録され、OS起動時に wmi_exporterが起動します。
懸念点があるとするならば必要以上に情報収集をしていることです。
(レジストリをいじれば--collectors.enabledの値を指定できるかもしれない…)
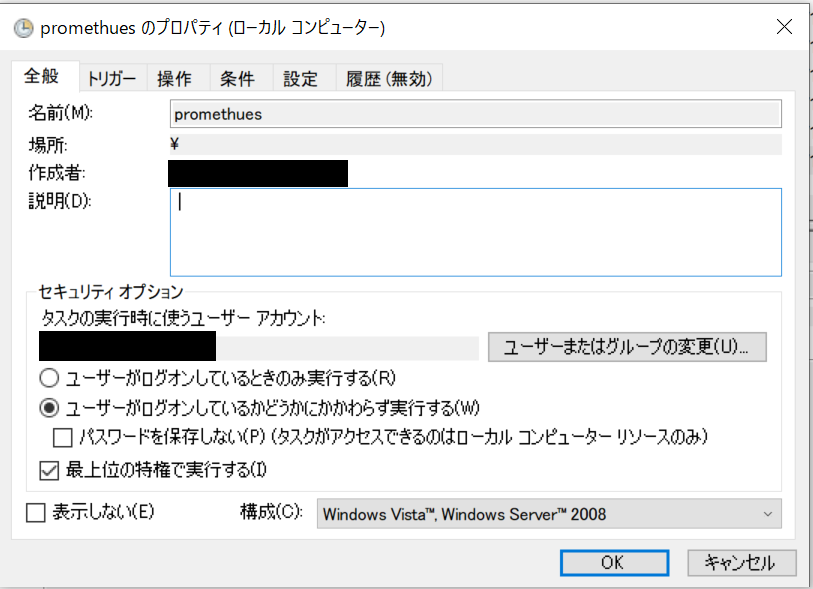
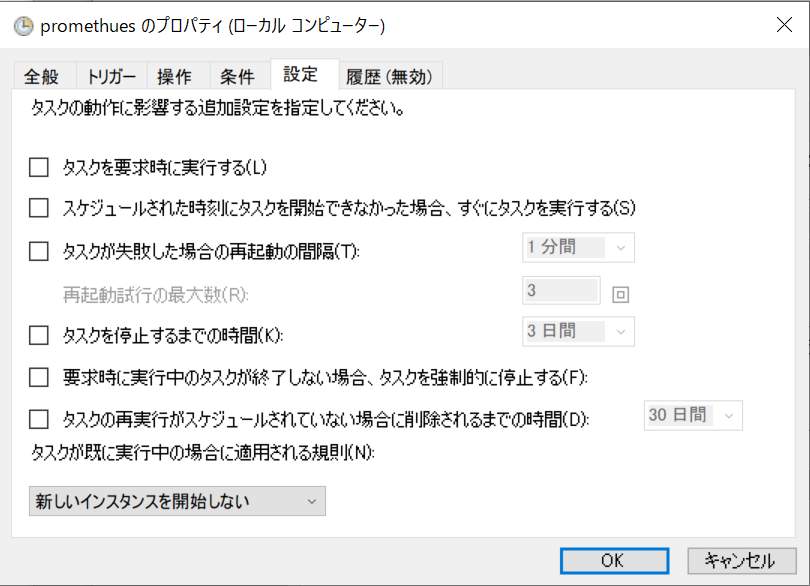
promethues は以下よりダウンロードし、最新版(2020/12/14時点)でも問題なく動作しました。
promethues はインストーラ版がありません。
そのため、サービス登録することで自動起動対応不可です。
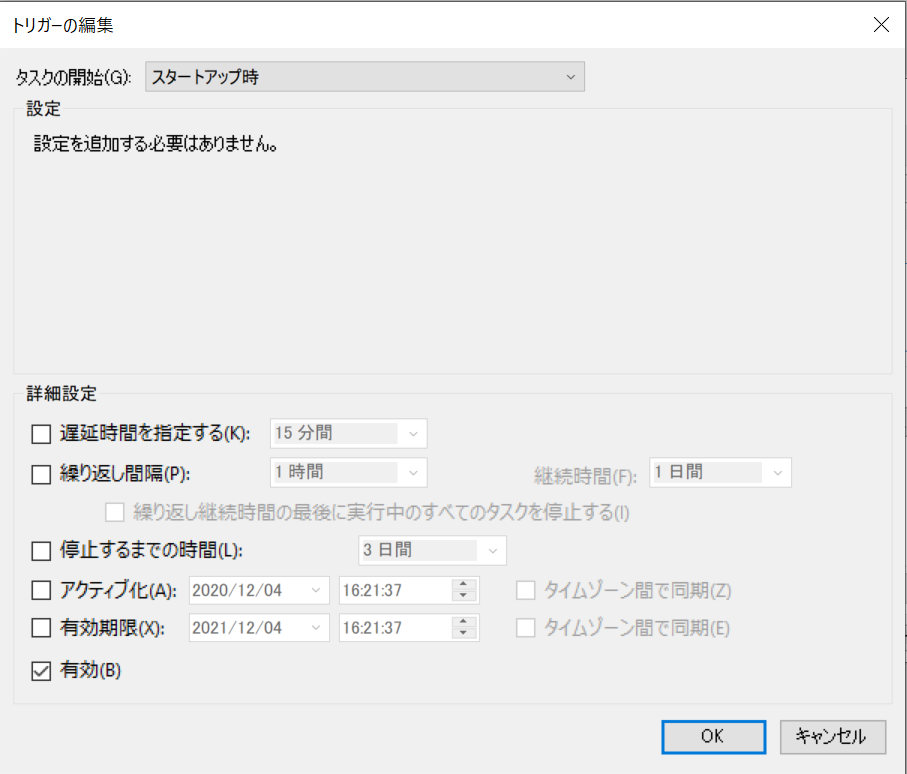
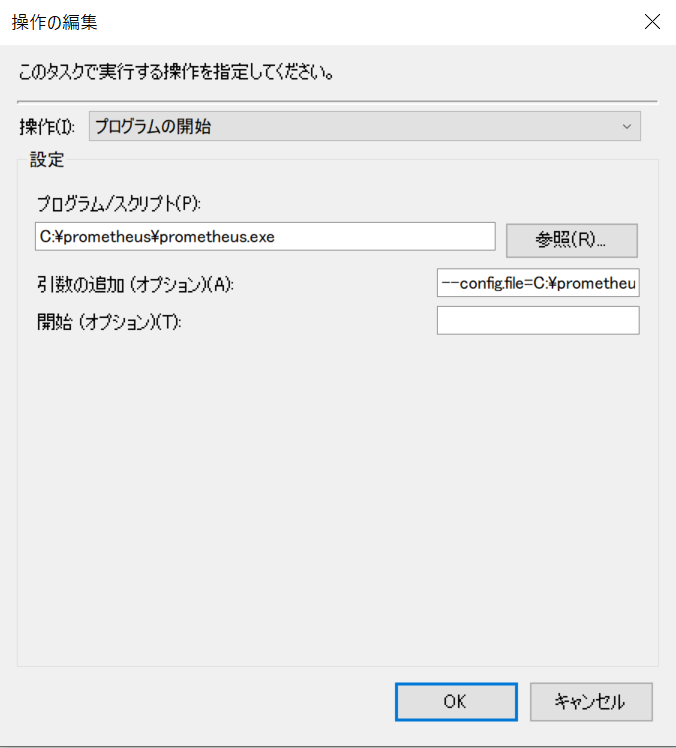
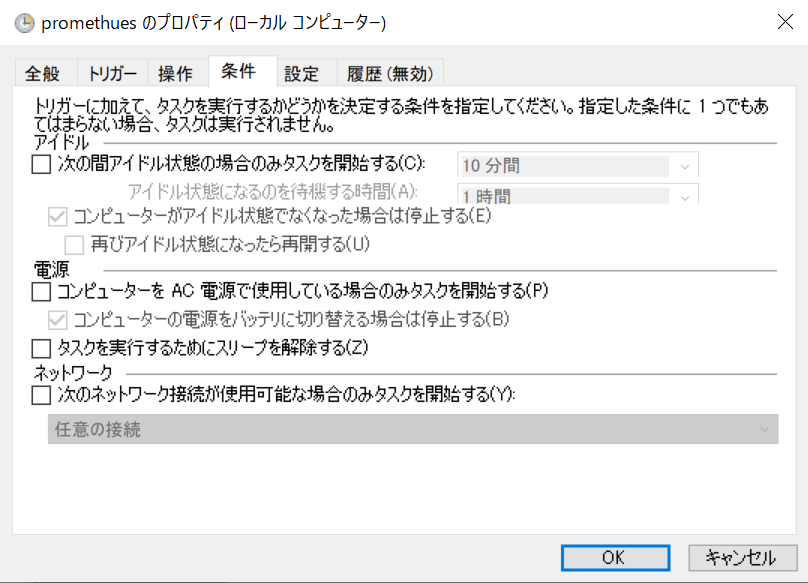
考えた結果、タスクスケジューラーを使うことにしました。
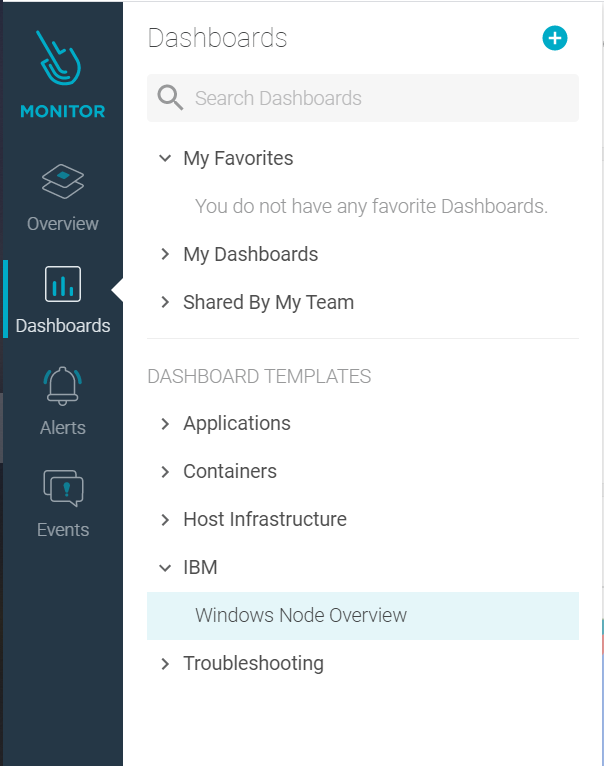
最初に紹介したqiitaの記事には、
Default Dashboards → Host & Containers → Windows Node Overview
となっていますが、現在は以下の画像の通り、DASHBOARD TEMPLATES に IBM が出現し、その中に Windows Node Overview があります。
Windows のデータを IBMCloud に転送するところまではできました。
次は、取得したデータをどのようにして活用し、アラート通知するかをまとめたいと思います。