IBM Cloud Monitoring with SysdigでWindowsサーバーを監視可能になりました。
-----------2023年8月追記ここから-----------
WindowsサーバーからIBM Cloud Monitoring(Sysdig)への連携方法が新しくなっています。下記Docsの情報をご確認ください。
https://cloud.ibm.com/docs/monitoring?topic=monitoring-windows
(一応、この記事も消さないでおきます)
-----------2023年8月追記ここまで-----------
手順は下記docsにあります。
-----------2021年3月追記ここから-----------
2021年3月時点では、下記docsの手順は、wmi_exporter-0.12.0-386.exe を前提として書かれています。この後のバージョンで、windows_exporterと名前も変わり、exporterの仕様が変わっており、それだと下記docsの手順では動きませんので、wmi_exporter-0.12.0-386.exeを使用するようにしてください。
-----------2021年3月追記ここまで-----------
https://cloud.ibm.com/docs/Monitoring-with-Sysdig?topic=Sysdig-windows&locale=en
Windows上で動かしたPrometheus WMI exporterで収集したデータをSysdigで収集・監視します。
初期セットアップの手順は概ね上記に記載の通りですが、実際に試してみます。
WMI exporterをダウンロードし、実行
監視対象のWindowsサーバー上でWMI exporterを実行します。
2020年5月22日時点で、Docsにはオプションとして"cpu,cs,logical_disk,net"の指定がありますが、これだと後続のPrometherusを実行時にエラーになりました。。Caseで確認したところ、オプションは"os,cpu,logical_disk,net,system"を指定するのが良いそうです。(Docs修正依頼済み)
実際に使う時はバックグラウンドで実行するのがよいでしょう。
> .\wmi_exporter-0.11.1-amd64.exe --collectors.enabled "os,cpu,logical_disk,net,system"
time="2020-05-18T03:37:27-05:00" level=info msg="Enabled collectors: os, cpu, logical_disk, net, system" source="exporter.go:327"
time="2020-05-18T03:37:27-05:00" level=info msg="Starting WMI exporter (version=0.11.1, branch=master, revision=7890c9ce9193c258c7cfe0df3aa3ecf1830aa0bc)" source="exporter.go:351"
time="2020-05-18T03:37:27-05:00" level=info msg="Build context (go=go1.13.3, user=appvyr-win\\appveyor@APPVYR-WIN, date=20200419-19:54:05)" source="exporter.go:352"
time="2020-05-18T03:37:27-05:00" level=info msg="Starting server on :9182" source="exporter.go:355"
Prometheus実行
Windowsから直接Sysdigに連携したいので、Step 3では、Option2を使います。
https://cloud.ibm.com/docs/Monitoring-with-Sysdig?topic=Sysdig-windows&locale=en#windows_step3_2
設定ファイル prometheus.yml にDocsに従いSysdigのIngest用のURLやラベル等を記入して、下記のようになりました。
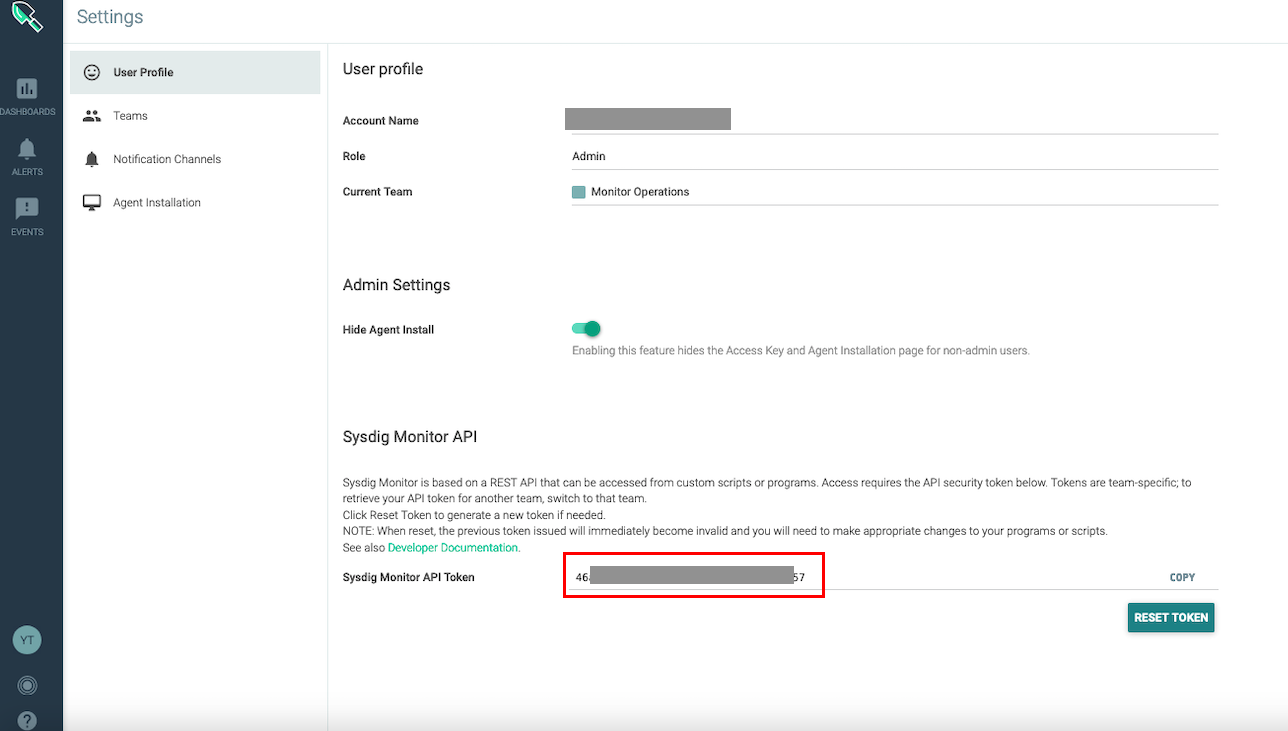
bearer_token_fileで指定するファイルの場所に、SysdigのSysdig Monitor API Tokenを書いたファイルを置いておきます。Sysdig Monitor API TokenはSysdig管理画面のSettingsで確認可能です。
# my global config
global:
  scrape_interval:     15s # Set the scrape interval to every 15 seconds. Default is every 1 minute.
  evaluation_interval: 15s # Evaluate rules every 15 seconds. The default is every 1 minute.
  # scrape_timeout is set to the global default (10s).

# Alertmanager configuration
alerting:
  alertmanagers:
  - static_configs:
    - targets:
      # - alertmanager:9093

# Load rules once and periodically evaluate them according to the global 'evaluation_interval'.
rule_files:
  # - "first_rules.yml"
  # - "second_rules.yml"

# A scrape configuration containing exactly one endpoint to scrape:
# Here it's Prometheus itself.
scrape_configs:
  - job_name: 'wmi_exporter'

    static_configs:
    - targets: ['localhost:9182']

      labels:
        job: "app"
        region: "jp-tok"
        instance: "tamavsi01win"

remote_write:
    - url: "https://ingest.private.jp-tok.monitoring.cloud.ibm.com/api/prometheus/write"

      bearer_token_file: C:\Users\Administrator\prom\sysdig-api

      write_relabel_configs:
       - source_labels: ["__name__"]
         regex: "^wmi_(.*)"
         action: keep

       - regex: "(__name__)|(job)|(region)|(instance)|(status)|(core)|(name)|(start_mode)|(nic)|(volume)|(state)|(version)|(mode)|(branch)|(timezone)|(goversion)|(collector)|(revision)"
         action: labelkeep
Prometheus.exeを実行します。これも、実際に使う時はバックグラウンドで実行するのがよいでしょう。
>.\prometheus.exe
level=info ts=2020-05-19T07:11:41.844Z caller=main.go:302 msg="No time or size retention was set so using the default time retention" duration=15d
level=info ts=2020-05-19T07:11:41.845Z caller=main.go:337 msg="Starting Prometheus" version="(version=2.18.1, branch=HEAD, revision=ecee9c8abfd118f139014cb1b174b08db3f342cf)"
level=info ts=2020-05-19T07:11:41.847Z caller=main.go:338 build_context="(go=go1.14.2, user=root@2117a9e64a7e, date=20200507-17:09:24)"
level=info ts=2020-05-19T07:11:41.847Z caller=main.go:339 host_details=(windows)
level=info ts=2020-05-19T07:11:41.848Z caller=main.go:340 fd_limits=N/A
level=info ts=2020-05-19T07:11:41.848Z caller=main.go:341 vm_limits=N/A
level=info ts=2020-05-19T07:11:41.869Z caller=main.go:678 msg="Starting TSDB ..."
level=info ts=2020-05-19T07:11:41.869Z caller=web.go:523 component=web msg="Start listening for connections" address=0.0.0.0:9090
level=info ts=2020-05-19T07:11:41.871Z caller=repair.go:59 component=tsdb msg="Found healthy block" mint=1589331413098 maxt=1589342400000 ulid=01E87FN8TK80KC178GZYEM40R0
level=info ts=2020-05-19T07:11:41.872Z caller=repair.go:59 component=tsdb msg="Found healthy block" mint=1589371200000 maxt=1589414400000 ulid=01E88RVK7B946WH8EX639P1BWV
level=info ts=2020-05-19T07:11:41.873Z caller=repair.go:59 component=tsdb msg="Found healthy block" mint=1589414400000 maxt=1589479200000 ulid=01E8AFSD9QBDQYAJ3CFR22KE3W
level=info ts=2020-05-19T07:11:41.873Z caller=repair.go:59 component=tsdb msg="Found healthy block" mint=1589479200000 maxt=1589544000000 ulid=01E8CDJY13S2FY3SFHY8GK300X
level=info ts=2020-05-19T07:11:41.874Z caller=repair.go:59 component=tsdb msg="Found healthy block" mint=1589544000000 maxt=1589608800000 ulid=01E8EBCEP65GAH80TRPV1R1S97
level=info ts=2020-05-19T07:11:41.875Z caller=repair.go:59 component=tsdb msg="Found healthy block" mint=1589608800000 maxt=1589673600000 ulid=01E8G95ZED8G50TBEEM3G1VP65
level=info ts=2020-05-19T07:11:41.875Z caller=repair.go:59 component=tsdb msg="Found healthy block" mint=1589673600000 maxt=1589738400000 ulid=01E8J6ZG4FZHSZ7YFTFW6TMXDG
level=info ts=2020-05-19T07:11:41.876Z caller=repair.go:59 component=tsdb msg="Found healthy block" mint=1589738400000 maxt=1589803200000 ulid=01E8M4S3P8RVGVQ9YF9ZCSHES0
level=info ts=2020-05-19T07:11:41.877Z caller=repair.go:59 component=tsdb msg="Found healthy block" mint=1589803200000 maxt=1589824800000 ulid=01E8MSC9ADVW35ATKSFPFRAVH9
level=info ts=2020-05-19T07:11:41.877Z caller=repair.go:59 component=tsdb msg="Found healthy block" mint=1589846400000 maxt=1589853600000 ulid=01E8NDZEFMFWH3HM2ZM9FZ18Q2
level=info ts=2020-05-19T07:11:41.878Z caller=repair.go:59 component=tsdb msg="Found healthy block" mint=1589824800000 maxt=1589846400000 ulid=01E8NDZJ07QBEVG28NJQCP0BCG
level=info ts=2020-05-19T07:11:41.879Z caller=repair.go:59 component=tsdb msg="Found healthy block" mint=1589853600000 maxt=1589860800000 ulid=01E8NMV5K6BV3Y62VP33KFNGWD
level=info ts=2020-05-19T07:11:41.879Z caller=repair.go:59 component=tsdb msg="Found healthy block" mint=1589860800000 maxt=1589868000000 ulid=01E8NVPWVCPEXVF6XCFT9DX055
level=info ts=2020-05-19T07:11:42.408Z caller=head.go:575 component=tsdb msg="Replaying WAL, this may take awhile"
level=info ts=2020-05-19T07:11:42.411Z caller=head.go:600 component=tsdb msg="WAL checkpoint loaded"
level=info ts=2020-05-19T07:11:42.416Z caller=head.go:624 component=tsdb msg="WAL segment loaded" segment=186 maxSegment=189
level=info ts=2020-05-19T07:11:42.427Z caller=head.go:624 component=tsdb msg="WAL segment loaded" segment=187 maxSegment=189
level=info ts=2020-05-19T07:11:42.431Z caller=head.go:624 component=tsdb msg="WAL segment loaded" segment=188 maxSegment=189
level=info ts=2020-05-19T07:11:42.433Z caller=head.go:624 component=tsdb msg="WAL segment loaded" segment=189 maxSegment=189
level=info ts=2020-05-19T07:11:42.433Z caller=head.go:627 component=tsdb msg="WAL replay completed" duration=23.0552ms
level=info ts=2020-05-19T07:11:42.435Z caller=main.go:694 fs_type=unknown
level=info ts=2020-05-19T07:11:42.435Z caller=main.go:695 msg="TSDB started"
level=info ts=2020-05-19T07:11:42.435Z caller=main.go:799 msg="Loading configuration file" filename=prometheus.yml
ts=2020-05-19T07:11:42.439Z caller=dedupe.go:112 component=remote level=info remote_name=667ec6 url=https://ingest.private.jp-tok.monitoring.cloud.ibm.com/api/prometheus/write msg="Starting WAL watcher" queue=667ec6
ts=2020-05-19T07:11:42.441Z caller=dedupe.go:112 component=remote level=info remote_name=667ec6 url=https://ingest.private.jp-tok.monitoring.cloud.ibm.com/api/prometheus/write msg="Replaying WAL" queue=667ec6
level=info ts=2020-05-19T07:11:43.317Z caller=main.go:827 msg="Completed loading of configuration file" filename=prometheus.yml
level=info ts=2020-05-19T07:11:43.317Z caller=main.go:646 msg="Server is ready to receive web requests."
ts=2020-05-19T07:11:50.177Z caller=dedupe.go:112 component=remote level=info remote_name=667ec6 url=https://ingest.private.jp-tok.monitoring.cloud.ibm.com/api/prometheus/write msg="Done replaying WAL" duration=7.7359573s
ts=2020-05-19T07:11:50.264Z caller=dedupe.go:112 component=remote level=error remote_name=667ec6 url=https://ingest.private.jp-tok.monitoring.cloud.ibm.com/api/prometheus/write msg="non-recoverable error" count=100 err="server returned HTTP status 400 Bad Request: {\"validationMessages\":[\"Ignoring 1 data point: time series has invalid metric name wmi_exporter_build_info (1 time)\",\"Ignoring 1 data point: time series has invalid metric name wmi_exporter_collector_duration_seconds (5 times)\",\"Ignoring 1 data point: time"
ts=2020-05-19T07:11:52.444Z caller=dedupe.go:112 component=remote level=info remote_name=667ec6 url=https://ingest.private.jp-tok.monitoring.cloud.ibm.com/api/prometheus/write msg="Remote storage resharding" from=1 to=1000
ts=2020-05-19T07:12:02.444Z caller=dedupe.go:112 component=remote level=info remote_name=667ec6 url=https://ingest.private.jp-tok.monitoring.cloud.ibm.com/api/prometheus/write msg="Remote storage resharding" from=1000 to=1
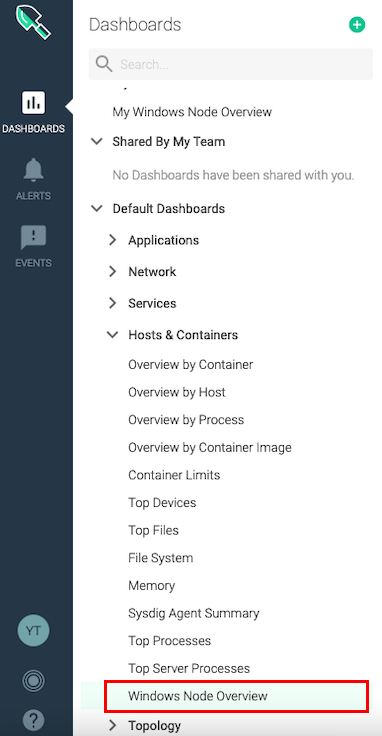
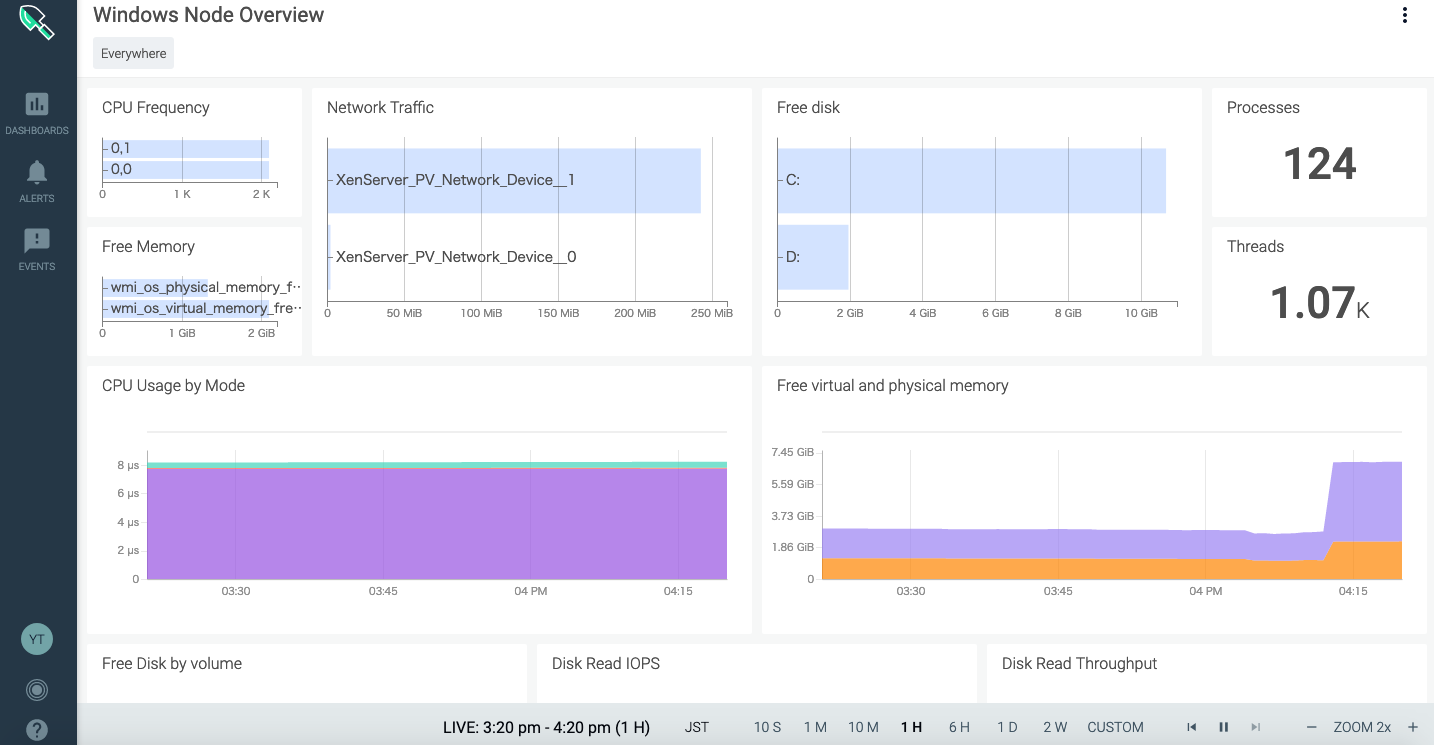
prometheusを実行してWMI ExporterからのデータがSysdig側に届き始めると、Sysdigの管理画面で、Windows用のダッシュボード"Windows Node Overview"が表示されます。(データが収集されていないうちは表示されません。)
Default Dashboardをコピー
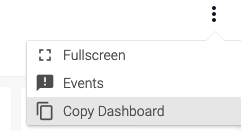
Default Dashboardは雛形のようなもので、そのままではカスタマイズしたりアラート設定をしたりできないので、右上の3点ドットからCopy Dashboardを選択し、Default Dashboardをコピーして自分用のDashboardを作成します。
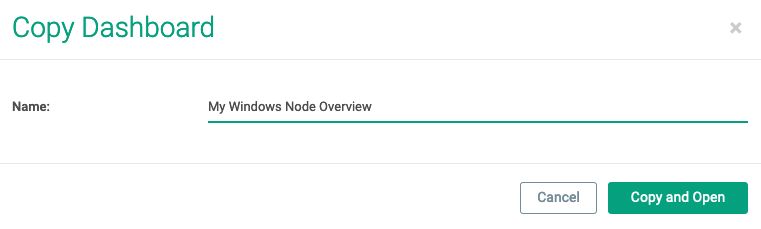
任意の名前をつけてCopy and Openを押下します。
見た目はDefault Dashboardとほとんど同じですが、右上のメニューが増えるなど、自分でできることが増えています。
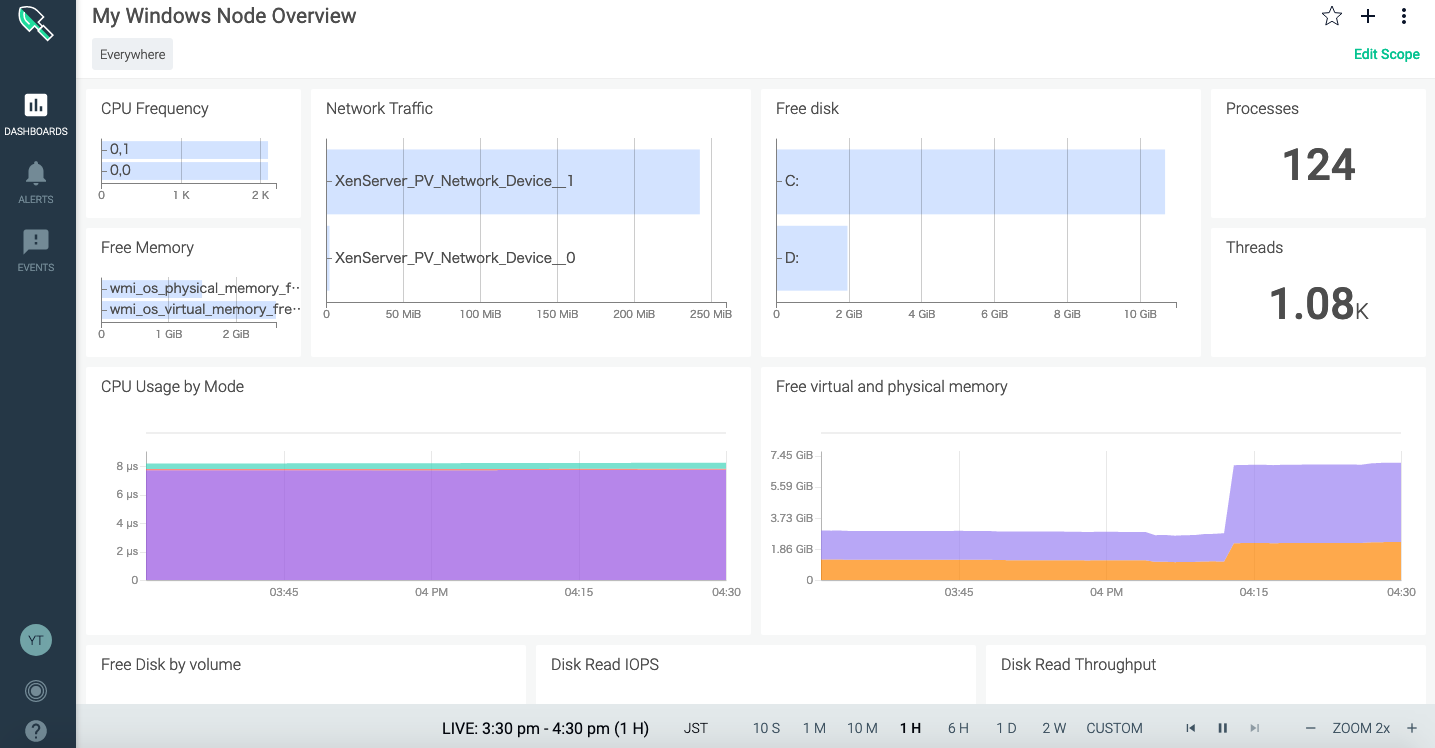
グラフのカスタマイズやアラートの設定もできるようになっています。
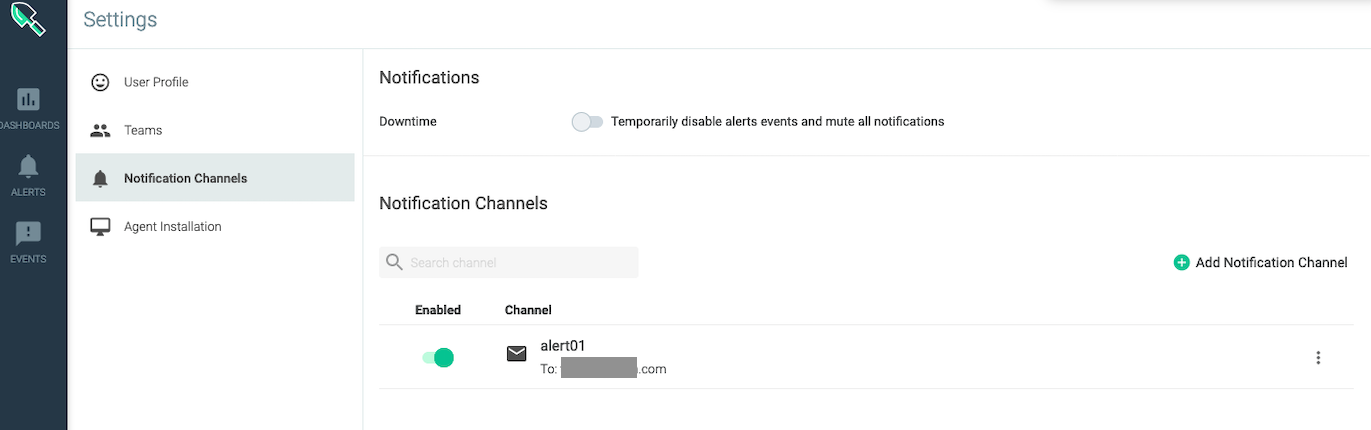
Notification設定
初めてSysdigを使う際は、監視の閾値に達したときの発報の設定をします。
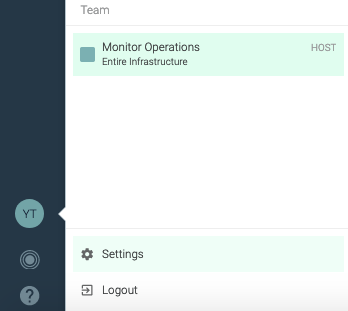
左下から、Settingsを選びます。
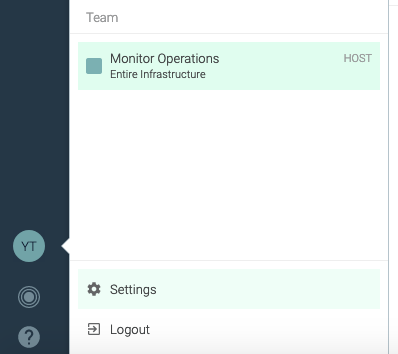
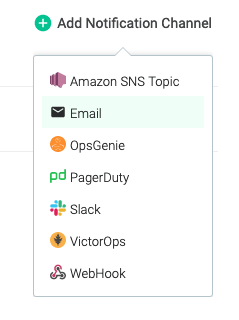
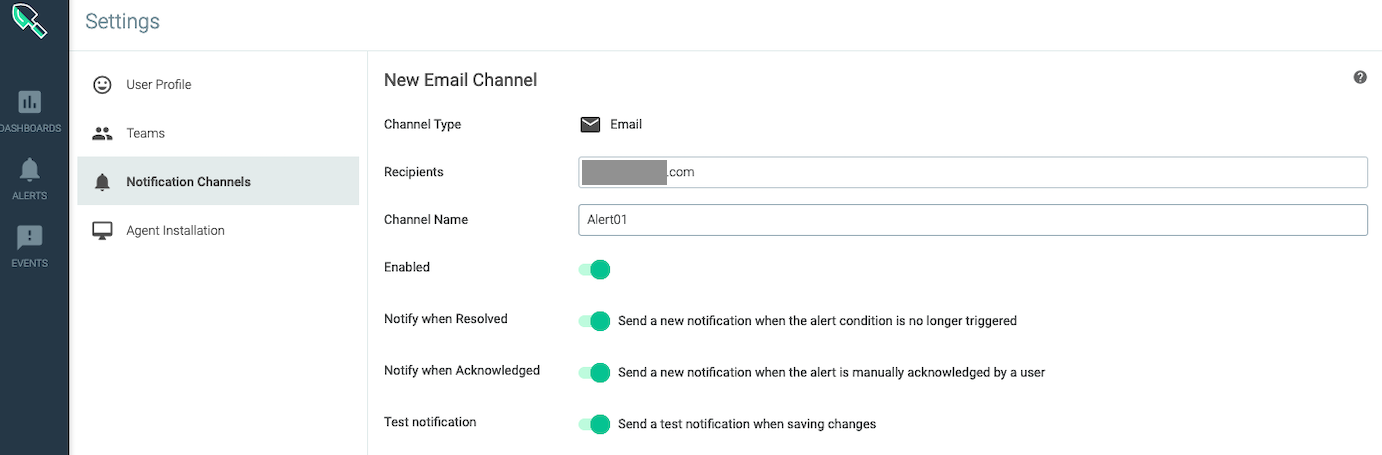
Settingsメニューから、Notification Channelで、通知方法・通知先を設定します。
今回はメール通知にしました。
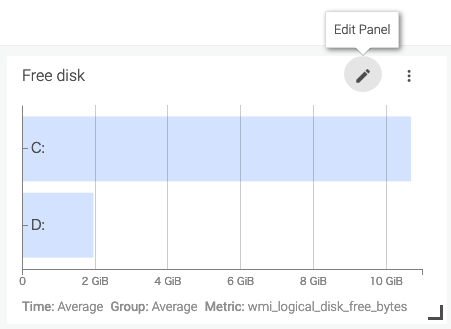
ストレージ使用率の監視
ストレージ使用率の監視はFree diskのパネルで設定します。
まず、棒グラフだと時系列が分かりづらいため、折れ線グラフに表示を切り替えます。
グラフのペンマークをクリックし、表示切り替えのポップアップを表示します。
折れ線グラフを選びます。
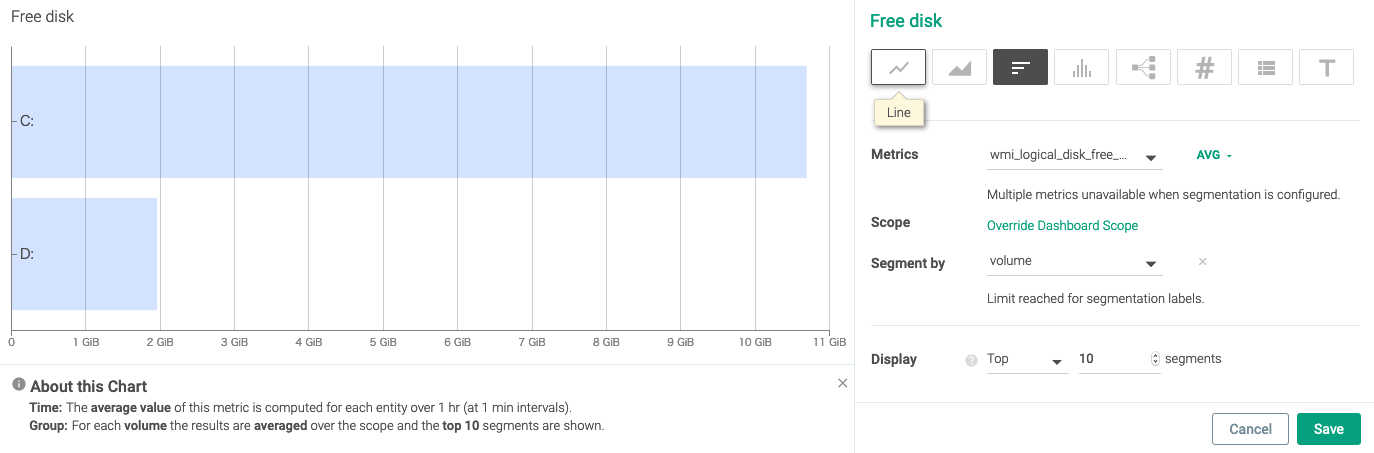
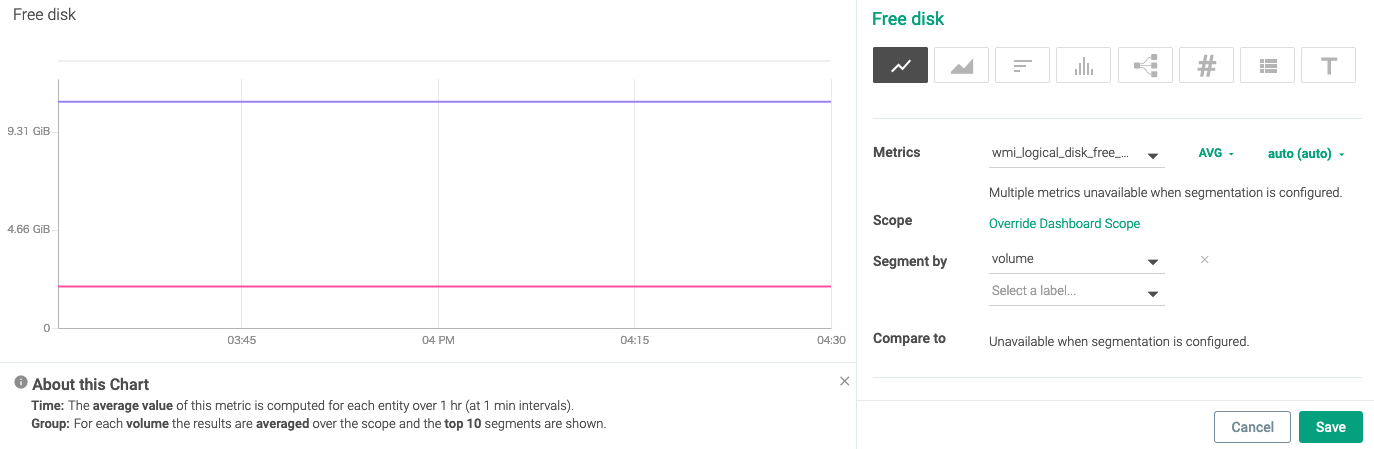
右下のSaveをクリックし、確定します。
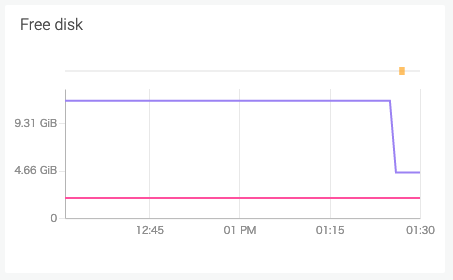
Free diskを時系列で追えるようになりました。
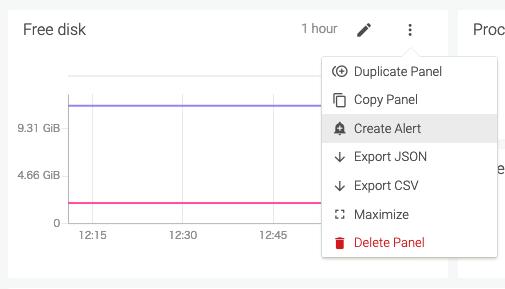
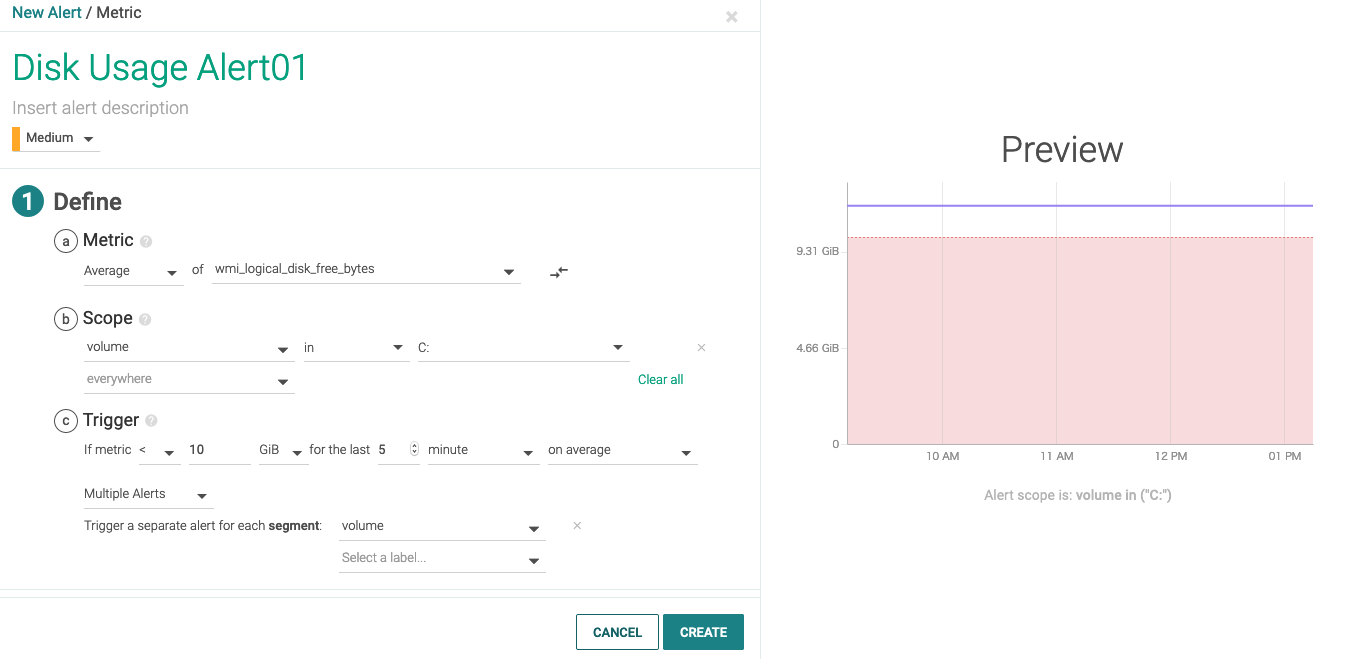
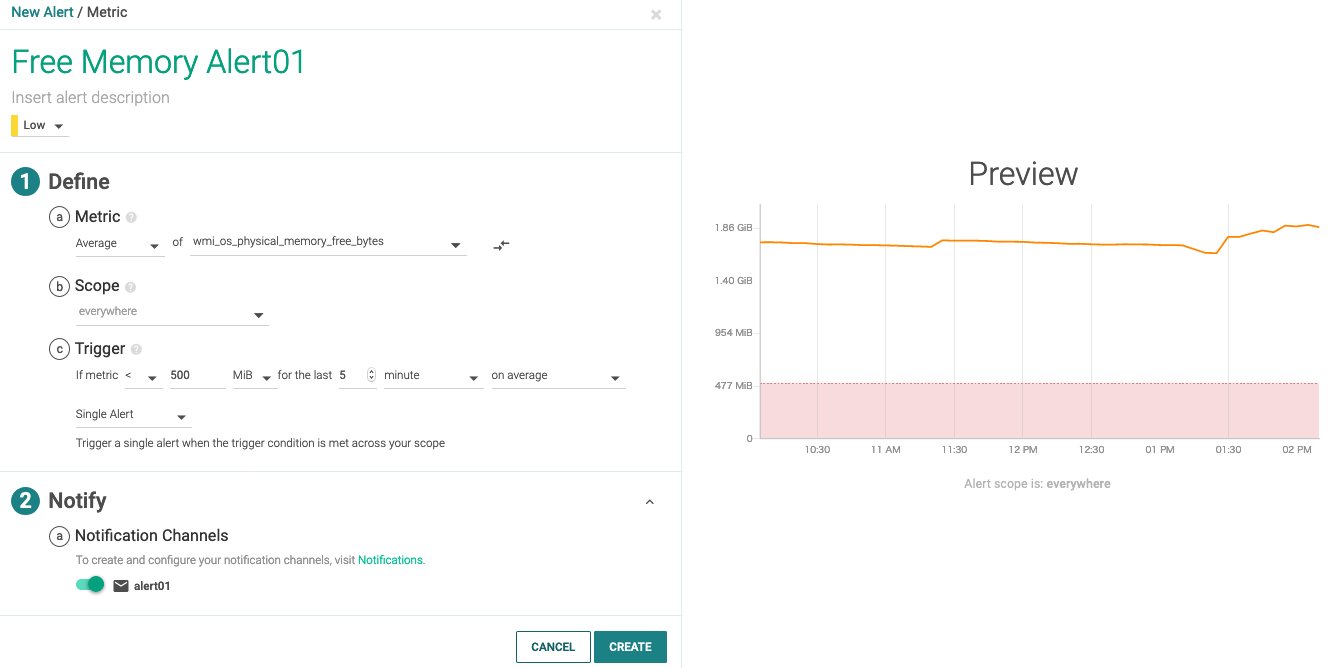
Create Alertから、監視設定を行います。
例えば、空き容量が10GB以下の状態が5分続いたら発報するという設定は下記となります。
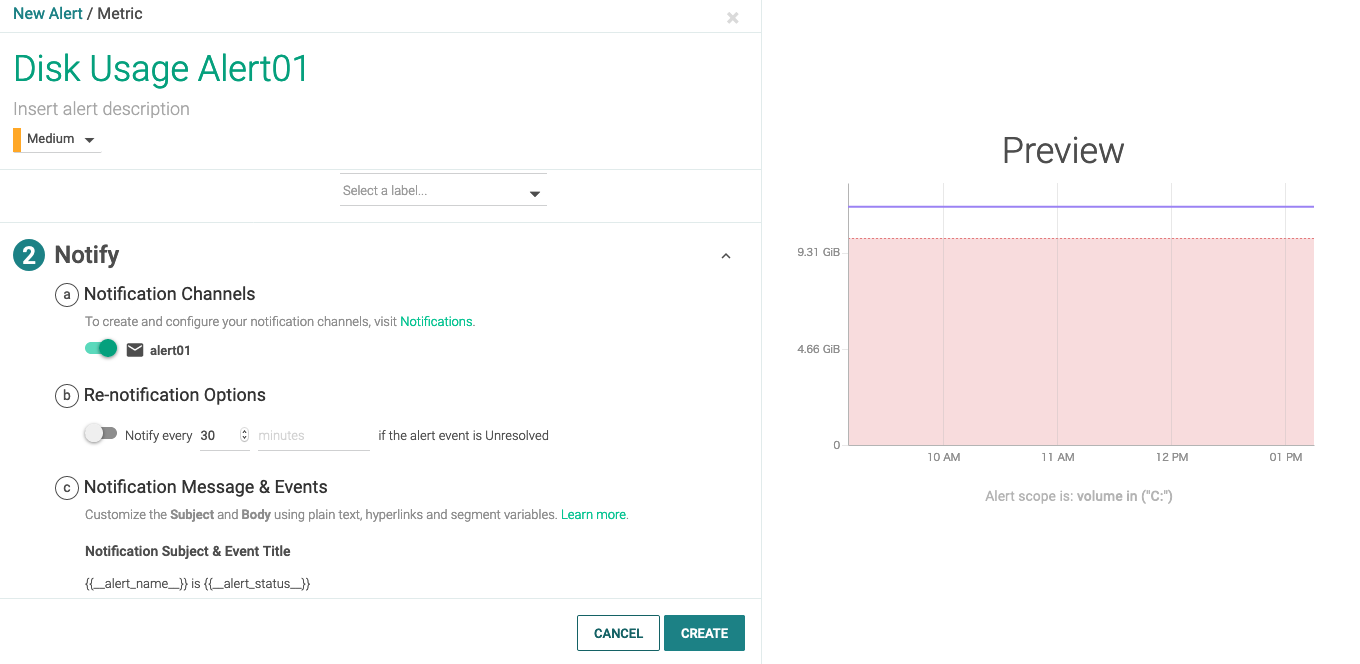
スクロールして、Notifyの項目で、先ほど定義したNotificationを有効にします。
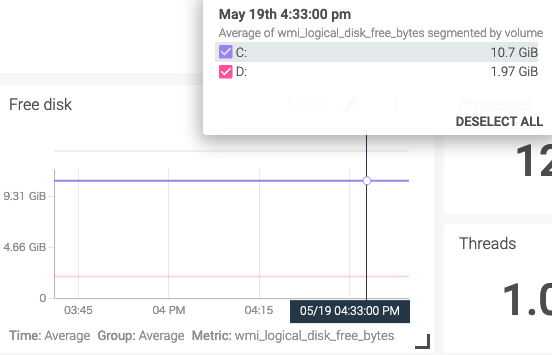
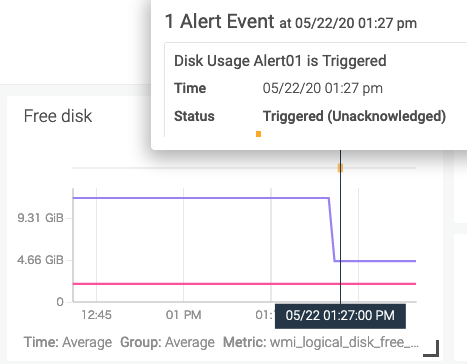
OSで実際にディスクの空き容量を減らしてしばらく待つと、その変化がグラフに反映され、閾値の10GBを切ったのでアラートに引っかかりました。(メールも飛びました)
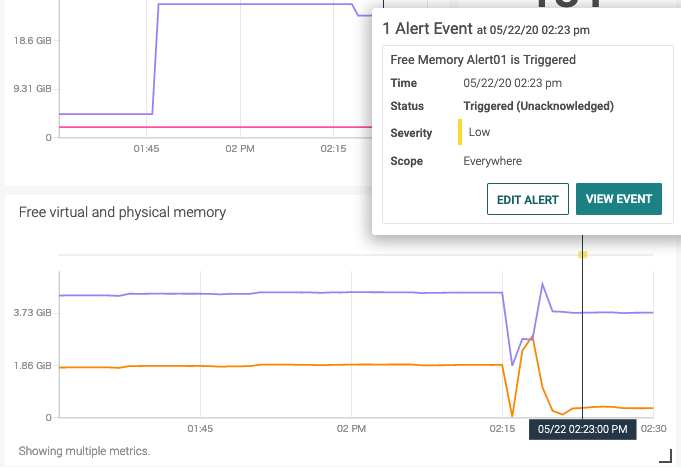
グラフの上にある色の付いた点が発報されたアラートで、カーソルを重ねると内容を確認できます。
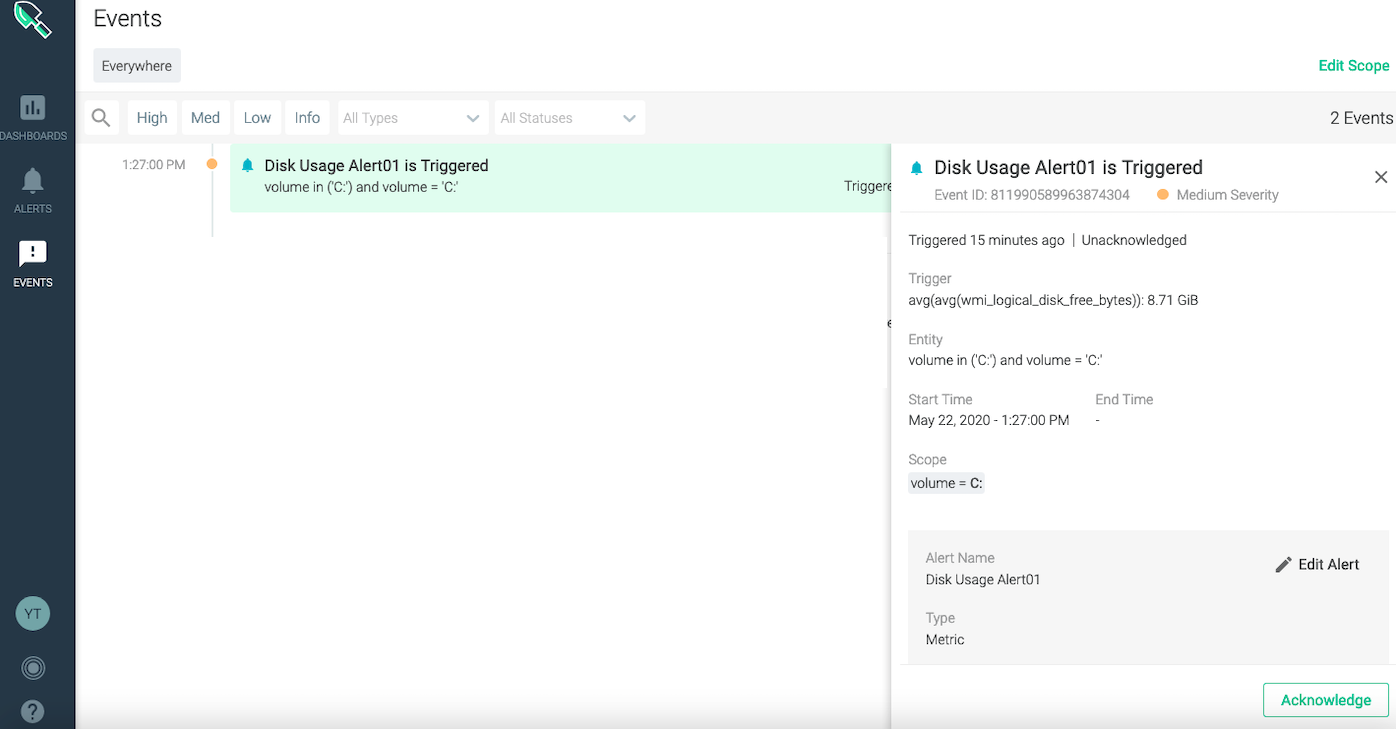
左側のメニューのEVENTSで、アラートの時系列が確認できます。EVENTのAcknowledgeもここで出来ます。
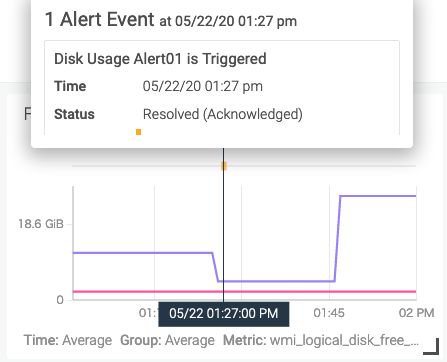
空き容量を増やしてしばらく待つと、アラートがResolvedのステータスになりました。
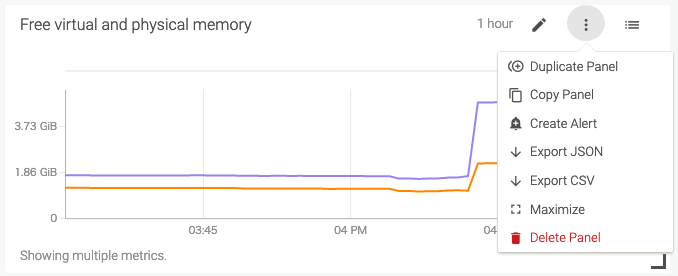
空きメモリの監視
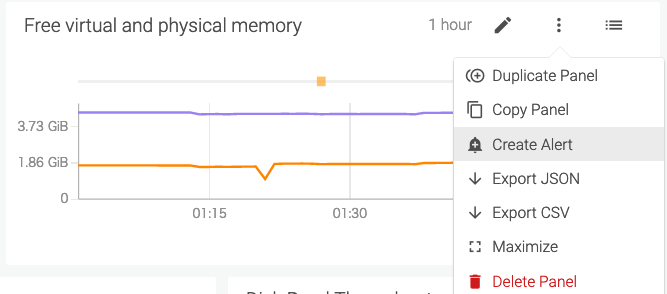
物理メモリの空きが500MiBを切って5分経ったら発報する、という条件としました。
OS上でメモリ使用量を増やし、しばらく待つと、グラフにも反映され、発報されました。