Matplotlib の特徴の一つに、非常に簡単に3次元グラフを描画できるという特徴があります。この特徴を利用して、地図ライブラリ Cartopy で地図を表示させた状態で震源の3次元散布図を描画することを試みました。
※表示している地震のデータは防災科学技術研究所が公開している地震のメカニズム ( 防災科研:メカニズム解の検索 ) からランダムに選びダウンロードしたものです。本ページ中の画像は個人がデモンストレーションとして描画したもので、その結果に学術的な意味を求めていません。
※本ページのスクリプトの利用は自己責任でお願いします。
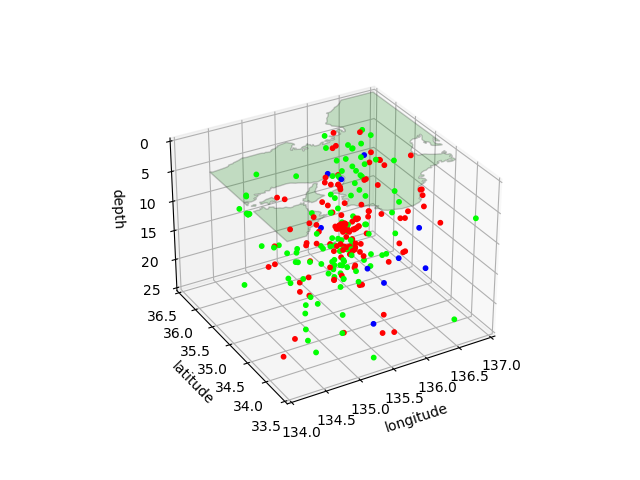
描画例
1. 目次
1. 目次
2. このページの目的
3. 使用環境
4. 地図を3次元グラフにどう落とし込むか
5. デモンストレーション
6. おわりに
7. 参考文献
2. このページの目的
震源の3次元位置をプロットした後、深さ0kmの位置に地図を描画すること。
3. 使用環境
- Windows 10
- conda 4.9.2
- python 3.8.5
- matplotlib 3.3.2
- obspy 1.2.2
- cartopy 0.18.0
4. 地図を3次元グラフにどう落とし込むか
さて、現状 Cartopy は Matplotlib における3次元プロットにそれほど対応していません。であるからして3次元プロットに表示させるには Matplotlib が対応している何かしらの形式に変換してあげる必要があります。ここでは Collection という形式に着目します。
基本的な方法については stackoverflow に前例があります。ユーザー mtb-za の質問 「contourf in 3D Cartopy」 に対してユーザー pelson が回答しており、本ページのスクリプトもこれを参考にしています。しかし同サイトでも指摘されている通り、pelson の回答ではエラーが出てしまいます。これについては今回はその場限りの解決策でしのいでいます。
pelson の回答したスクリプトは基本的に次のような流れになっています。
- Cartopy から描画する feature を指定
- feature から geometry のみを取得
- geometry を描画したい投影法 (ここでは正距円筒図法) に変換
- 描画している matplotlib の axes から描画範囲を取得し、これと交差する geometry との間で intersection なるメソッドを適用
- geometry を path に変換
- path を polygon に変換
- polygon を collection に変換
ところが intersection をする際にいくつかの geometry が invalid であるというエラーが出ます。想像するに geometry を構成する線分の一部が互いに交差したりしていると思われます。これではスクリプトが動かないので、 intersection の前に invalid な geometry を排除するコードを挿入しました。見た感じ特に問題がない結果が表示されました (ほかの領域、投影法でどうなるかまでは追っていません)。
5. デモンストレーション
使用しているデータの冒頭部分は以下の通り。
longitude	latitude	depth	strike1	dip1	rake1	strike2	dip2	rake2	mantissa	exponent	type
136.3025	36.2495	11	63	59	94	236	31	84	2.66	21	1
135.5475	35.2028	20	334	85	11	243	79	175	9.92	21	2
136.72	    35.1692	14	3	70	105	145	25	55	3.43	21	1
134.8153	34.4015	11	293	87	28	201	62	177	4.23	21	2
このうち経度緯度深さそして主応力軸の方向から判定した断層の種類(type)を描画に用います。
import itertools
import pandas as pd
import cartopy.feature
import cartopy.crs as ccrs
import matplotlib.pyplot as plt
from mpl_toolkits.mplot3d import Axes3D
from cartopy.mpl.patch import geos_to_path
from matplotlib.collections import PolyCollection

mfile = pd.read_csv("temp.csv") # データ
loc = mfile[["longitude", "latitude", "depth"]]
typ = mfile[["type"]] # 正断層型か、など。0 = 正断層, 1 = 逆断層, 2 = 横ずれ断層
pallet = ["blue", "red", "lime"] # 断層タイプにより色分けする

pallet_list = [] # 色をリスト化
for i in range(len(typ)) :
    pallet_list.append(pallet[int(typ.iloc[i,0])])

# メインのプロット
fig = plt.figure()
ax3d = fig.add_subplot(111, projection='3d')
# 領域の指定
ax3d.set_xlim(134.0,137.0)
ax3d.set_ylim(33.5,36.5)
ax3d.set_zlim(25,0)
# ラベル
ax3d.set_xlabel("longitude")
ax3d.set_ylabel("latitude")
ax3d.set_zlabel("depth")
# 散布図
ax3d.scatter(loc["longitude"],loc["latitude"],loc["depth"],"o", c=pallet_list,s=10,depthshade=0)

# 地図のためのaxisを設定
proj_ax = plt.figure().add_subplot(111, projection=ccrs.PlateCarree())
proj_ax.set_xlim(ax3d.get_xlim())
proj_ax.set_ylim(ax3d.get_ylim())
# a usefull function
concat = lambda iterable: list(itertools.chain.from_iterable(iterable))
# geometryの取得
target_projection = proj_ax.projection
feature = cartopy.feature.NaturalEarthFeature('physical', 'land', '10m')
geoms = feature.geometries()
# 領域取得
boundary = proj_ax._get_extent_geom()
# 投影方法の変換
geoms = [target_projection.project_geometry(geom, feature.crs) for geom in geoms]

# invalid な geometryの排除
geoms2 = []
for i in range(len(geoms)) :
    if geoms[i].is_valid :
        geoms2.append(geoms[i])

geoms = geoms2

# intersection
geoms = [boundary.intersection(geom) for geom in geoms]
# geometry to path to polygon to collection
paths = concat(geos_to_path(geom) for geom in geoms)
polys = concat(path.to_polygons() for path in paths)
lc = PolyCollection(polys, edgecolor='black', facecolor='green', closed=True, alpha=0.2)

# 挿入
ax3d.add_collection3d(lc, zs=0)
ax3d.view_init(elev=30, azim=-120)
plt.close(proj_ax.figure) # 閉じないと plt.showで2個出てくる
fig.savefig("sample2.png")
plt.show()
# plt.close(fig)
表示結果
ちなみに intersection しないと描画領域から地図がはみ出すと思います。
6. おわりに
いかがでしたでしょうか。3D プロットをマウスで動かして遊ぶの楽しいですよね(笑)。ほかの投影法については Cartopy の公式サイトにも記載がありますのでそれらをご活用ください。
7. 参考文献
- 防災科学技術研究所 広帯域地震観測網 (F-net) メカニズム解の検索
https://www.fnet.bosai.go.jp/event/search.php?LANG=ja - Introduction — cartopy 0.18.0 documentation
https://scitools.org.uk/cartopy/docs/latest/index.html - Using cartopy with matplotlib — cartopy 0.18.0 documentation
https://scitools.org.uk/cartopy/docs/latest/matplotlib/intro.html - matplotlib - contourf in 3D Cartopy - Stack Overflow
https://stackoverflow.com/questions/48269014/contourf-in-3d-cartopy