はじめに
Carto tileについて情報を更新する可能性もあり、そのためこちらの記事で作成したベクトルタイルを用いてMaputnikでスタイリングを行い、Maplibre GL JSで地図表示してみます。さらにポップアップの設定もしています。
Maputnikを用いてスタイリングをする
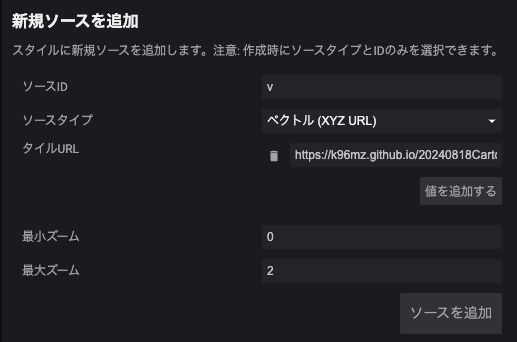
Maputnikを用いてスタイリングしていきます。まずは、作成したベクトルタイルを新規ソースとして追加します。ベクトルタイルはズームレベル4まで作成していますが、最大ズームはCarto tileのページに合わせて2としています。つまり、データとしてはズームレベル4までありますが、使用するデータはズームレベル2までです。ズームレベルが4まで拡大されていたとしても、使用されているデータはズームレベル2のものとなります。
ここからは、以前に記事にしたcartotile-plain-designのコードのスタイルに沿ってスタイル付けをしていきます。ポップアップの表示の解説もこちらの記事を参考にしてください。
背景(back ground)
まずは、背景(back ground)のレイヤを作成します。
レイヤ名: bg
色: rgb(255, 255, 255)
bnda(ポリゴン)
次に、以下のようにしてbnda(ポリゴン)をレイヤとして追加します。
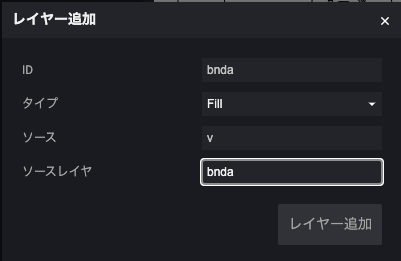
そして、以下の通りスタイルを設定します。
Min Zoom: 0
Max Zoom: 4
Filter: no filter matches
iso3cd == ATA(始めにISO3CDとしていましたが、正常に反映されませんでした。大文字・小文字は分けて読み込まれるようなので注意です。)
Color: rgb(237, 237, 237)
「iso3cd」はISOに基づいて、3文字のアルファベットで表される国名だと思われます。ATAは南極(antarcticの略かも)を表してるので、南極以外を表示しています。
bndl(ライン)
次にbndl(ライン)を使用してレイヤを設定しますが、一つのソースレイヤbndlから以下の3つのレイヤを作成します。
・bndl_solid
・bndl_dashed
・bndl_dotted
bndl_solid
ID: bndl_solid
Min Zoom: 0
Max Zoom: 4
Filter: any filter matches
bdytyp == 0
bdytyp == 1
bdytyp == 2
Color: rgb(77, 77, 77)
Width: 0.8
bdytypが、 0 or 1 or 2である地物を対象としています。
bdytypはおそらく、boundary typeの略だと思われます。QGISで調べてみたところ、0が海岸線、1が内陸の国境線でした。2はデータが存在しません。
bndl_dashed
ID: bndl_dashed
Min Zoom: 0
Max Zoom: 4
Filter: every filter matches
bdytyp == 3
Color: rgb(77, 77, 77)
Width: 0.8
Dasharray: 3, 2
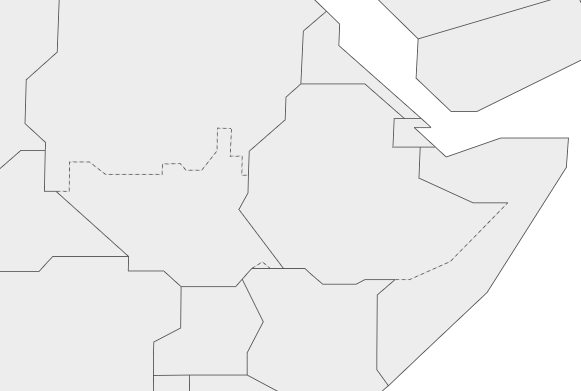
bdytypが3である地物を対象としています。
3は合意されていない国境線だと思われます。
"line-dasharray": [3, 2]として、線が3ピクセル描かれ、2ピクセルの間隔が空く、という繰り返しのパターンが適用されます。アフリカ北東部は以下のように表示されます。
bndl_dotted
ID: bndl_dotted
Min Zoom: 0
Max Zoom: 4
Filter: every filter matches
bdytyp == 4
Color: rgb(77, 77, 77)
Width: 0.8
Dasharray: 1, 2
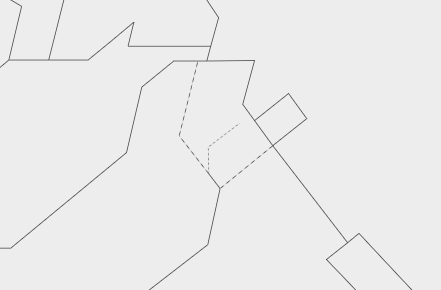
bdytypが4である地物を対象としています。
4はカシミール地方のデータが1つのみ存在します。"line-dasharray": [1, 2]として、線が1ピクセル描かれ、2ピクセルの間隔が空く、という繰り返しのパターンが適用されます。以下のように、図の中心部分のように表現になります。
スタイルファイルを作成したら、Maputnik上でダウンロードします。
作成したスタイルファイルは、こちらにあります。Maputnikでインポートする場合は、以下のURLを使用できます。
https://k96mz.github.io/20240818CartoTileStylized/CartoTile_style.json
コードも以下に示します。
{
  "version": 8,
  "name": "Empty Style",
  "metadata": {"maputnik:renderer": "mlgljs"},
  "sources": {
    "v": {
      "type": "vector",
      "tiles": [
        "https://k96mz.github.io/20240818CartoTileStylized/Data/VTstylized/{z}/{x}/{y}.pbf"
      ],
      "minzoom": 0,
      "maxzoom": 2
    }
  },
  "sprite": "",
  "glyphs": "https://orangemug.github.io/font-glyphs/glyphs/{fontstack}/{range}.pbf",
  "layers": [
    {
      "id": "bg",
      "type": "background",
      "layout": {"visibility": "visible"},
      "paint": {"background-color": "rgb(255, 255, 255)"}
    },
    {
      "id": "bnda",
      "type": "fill",
      "source": "v",
      "source-layer": "bnda",
      "maxzoom": 4,
      "filter": ["none", ["==", "iso3cd", "ATA"]],
      "paint": {"fill-color": "rgb(237, 237, 237)"}
    },
    {
      "id": "bndl_solid",
      "type": "line",
      "source": "v",
      "source-layer": "bndl",
      "maxzoom": 4,
      "filter": [
        "any",
        ["==", "bdytyp", 0],
        ["==", "bdytyp", 1],
        ["==", "bdytyp", 2]
      ],
      "paint": {"line-color": "rgb(77, 77, 77)", "line-width": 0.8}
    },
    {
      "id": "bndl_dashed",
      "type": "line",
      "source": "v",
      "source-layer": "bndl",
      "maxzoom": 4,
      "filter": ["all", ["==", "bdytyp", 3]],
      "paint": {
        "line-color": "rgb(77, 77, 77)",
        "line-width": 0.8,
        "line-dasharray": [3, 2]
      }
    },
    {
      "id": "bndl_dotted",
      "type": "line",
      "source": "v",
      "source-layer": "bndl",
      "maxzoom": 4,
      "filter": ["all", ["==", "bdytyp", 4]],
      "paint": {
        "line-color": "rgb(77, 77, 77)",
        "line-width": 0.8,
        "line-dasharray": [1, 2]
      }
    }
  ],
  "id": "dgzy6oo"
}
スタイルファイルの統合
Maputnikで作成したスタイルファイルをcartotile-plain-designで使用されているものに近づけていきます。スタイルファイルをindex.htmlに統合したものは以下の通りです。index.htmlはこちらの記事を参考に記載しています。
<!DOCTYPE html>
<html lang="en">
<head>
<title>Display a map</title>
<!-- <meta
property="og:description"
content="Initialize a map in an HTML element with MapLibre GL JS."
/> -->
<meta charset="utf-8" />
<meta name="viewport" content="width=device-width, initial-scale=1" />
<link
rel="stylesheet"
href="https://unpkg.com/maplibre-gl@4.5.0/dist/maplibre-gl.css"
/>
<script src="https://unpkg.com/maplibre-gl@4.5.0/dist/maplibre-gl.js"></script>
<style>
body {
margin: 0;
top: 0;
bottom: 0;
width: 100%;
}
p.stscod1 {
font-style: normal;
font-size: 9pt;
font-family: "arial", "Roboto";
}
p.stscod2 {
font-style: italic;
font-size: 8.5pt;
font-family: "arial", "Roboto";
}
p.stscod3 {
font-style: normal;
font-size: 9pt;
font-family: "arial", "Roboto";
}
p.stscod4 {
font-style: normal;
font-size: 8.5pt;
font-family: "arial", "Roboto";
}
p.stscod5 {
font-style: normal;
font-size: 8.5pt;
font-family: "arial", "Roboto";
}
p.stscod6 {
font-style: italic;
font-size: 8pt;
font-family: "arial", "Roboto";
}
p.stscod99 {
font-style: normal;
font-size: 6.5pt;
font-family: "arial", "Roboto";
}
#map {
position: absolute;
top: 0;
bottom: 0;
width: 100%;
}
</style>
</head>
<body>
<div id="map"></div>
<script>
const map = new maplibregl.Map({
container: "map", // container id
attributionControl: false,
hash: true,
renderWorldCopies: false,
maxZoom: 3,
zoom: 0.8, // starting zoom
style: {
version: 8,
// name: "Empty Style",
// metadata: { "maputnik:renderer": "mlgljs" },
sources: {
v: {
type: "vector",
tiles: [
"https://k96mz.github.io/20240818CartoTileStylized/Data/VTstylized/{z}/{x}/{y}.pbf",
],
attribution:
'<table><tr><td style="font-size: 7pt; line-height: 100%">The boundaries and names shown and the designations used on this map do not imply official endorsement or acceptance by the United Nations. Final boundary between the Republic of Sudan and the Republic of South Sudan has not yet been determined.<br>* Non-Self Governing Territories<br>** Dotted line represents approximately the Line of Control in Jammu and Kashmir agreed upon by India and Pakistan. The final status of Jammu and Kashmir has not yet been agreed upon by the parties.<br>*** A dispute exists between the Governments of Argentina and the United Kingdom of Great Britain and Northern Ireland concerning sovereignty over the Falkland Islands (Malvinas).</td><td style="font-size: 5pt; color: #009EDB" valign="bottom">Powered by<br><img src="https://unopengis.github.io/watermark/watermark.png" alt="UN OpenGIS logo" width="50" height="50"></td></tr></table>',
minzoom: 0,
maxzoom: 2,
},
},
sprite: "",
glyphs:
"https://UN-Geospatial.github.io/cartotile-plain-design/font/{fontstack}/{range}.pbf",
transition: {
  duration: 0,
  delay: 0,
},
layers: [
{
id: "bg",
type: "background",
layout: { visibility: "visible" },
paint: { "background-color": "rgb(255, 255, 255)" },
},
{
id: "bnda",
type: "fill",
source: "v",
"source-layer": "bnda",
maxzoom: 4,
filter: ["none", ["==", "iso3cd", "ATA"]],
paint: { "fill-color": "rgb(237, 237, 237)" },
},
{
id: "bndl_solid",
type: "line",
source: "v",
"source-layer": "bndl",
maxzoom: 4,
filter: [
"any",
["==", "bdytyp", 0],
["==", "bdytyp", 1],
["==", "bdytyp", 2],
],
paint: { "line-color": "rgb(77, 77, 77)", "line-width": 0.8 },
},
{
id: "bndl_dashed",
type: "line",
source: "v",
"source-layer": "bndl",
maxzoom: 4,
filter: ["all", ["==", "bdytyp", 3]],
paint: {
"line-color": "rgb(77, 77, 77)",
"line-width": 0.8,
"line-dasharray": [3, 2],
},
},
{
id: "bndl_dotted",
type: "line",
source: "v",
"source-layer": "bndl",
maxzoom: 4,
filter: ["all", ["==", "bdytyp", 4]],
paint: {
"line-color": "rgb(77, 77, 77)",
"line-width": 0.8,
"line-dasharray": [1, 2],
},
},
],
// id: "dgzy6oo",
},
// maplibreLogo: true,
});
map.addControl(new maplibregl.AttributionControl({ compact: false }));
map.on("load", () => {
map.addControl(new maplibregl.NavigationControl());
});
const popup = new maplibregl.Popup({
closeButton: false,
closeOnClick: false,
});
map.on("mousemove", "bnda", function (e) {
map.getCanvas().style.cursor = "pointer";
// console.log(e);
// console.log(e.features[0].properties);
if (e.features[0].properties.stscod == 1) {
const html =
"<p class='stscod1'>" +
e.features[0].properties.nam_en.toUpperCase() +
"</p>";
popup.setLngLat(e.lngLat).setHTML(html).addTo(map);
} else if (e.features[0].properties.stscod == 2) {
const html =
"<p class='stscod2'>" +
e.features[0].properties.nam_en.toUpperCase() +
"</p>";
popup.setLngLat(e.lngLat).setHTML(html).addTo(map);
} else if (e.features[0].properties.stscod == 3) {
let html;
if (
e.features[0].properties.nam_en == "Falkland Islands (Malvinas) ***"
) {
html =
"<p class='stscod3'>" + e.features[0].properties.nam_en + "</p>";
} else {
html =
"<p class='stscod3'>" + e.features[0].properties.nam_en + "</p>";
}
popup.setLngLat(e.lngLat).setHTML(html).addTo(map);
} else if (e.features[0].properties.stscod == 4) {
const html =
"<p class='stscod4'>" + e.features[0].properties.nam_en + "</p>";
popup.setLngLat(e.lngLat).setHTML(html).addTo(map);
} else if (e.features[0].properties.stscod == 5) {
const html =
"<p class='stscod5'>" + e.features[0].properties.nam_en + "</p>";
popup.setLngLat(e.lngLat).setHTML(html).addTo(map);
} else if (e.features[0].properties.stscod == 6) {
const html =
"<p class='stscod6'>" + e.features[0].properties.nam_en + "</p>";
popup.setLngLat(e.lngLat).setHTML(html).addTo(map);
} else if (e.features[0].properties.stscod == 99) {
// if (e.features[0].properties.nam_en == "Jammu and Kashmir **") {
if (e.features[0].properties.nam_en == "Jammu and Kashmir") {
const html =
"<p class='stscod6'>" + e.features[0].properties.nam_en + "</p>";
popup.setLngLat(e.lngLat).setHTML(html).addTo(map);
} else {
popup.remove();
}
}
});
map.on("mouseleave", "bnda", function () {
map.getCanvas().style.cursor = "";
popup.remove();
});
</script>
</body>
</html>
コードの解説
スタイルファイルをindex.htmlに統合後、以下を追記。
attributionControl: false,
hash: true,
renderWorldCopies: false,
maxZoom: 3,
zoom: 0.8,
Attribution
map.addControl(new maplibregl.AttributionControl({ compact: false }));
上記のコードを追加しました。AttributionControlのオプションとして、「compact: false」とすることで、地図を操作した時も、アトリビューション(著作権表示)」が常に表示されます。他にやり方があるのかもしれませんが、「attributionControl: false」と上記の組み合わせでうまく表示されます。以下はAttributionControlOptionsの参考ページです。
glyphs
glyphs:"https://UN-Geospatial.github.io/cartotile-plain-design/font/{fontstack}/{range}.pbf",
glyphsを追加します。フォントは、cartotile-plain-designで使用されているものをそのままコピーして保存したものを使用します。
transition
transition: {
duration: 0,
delay: 0,
},
transition は、地図スタイルの変更時に使用されるアニメーション効果を制御する設定です。必要なのかどうか分かりませんが、とりあえず記載しておきます。
ポップアップ制御部分の記載
cartotile-plain-designとは属性の名前等が異なっています。cartotile-plain-designでは、e.features[0].properties.MAPLABは国名を示していますが、こちらでは、e.features[0].properties.nam_enです。
e.features[0].properties.STSCODは、こちらでは小文字でe.features[0].properties.stscodです。
これらを反映させて、ポップアップ部分のコードを記載しました。
また、使用されるクラスのスタイルも記載しました。
"Jammu and Kashmir **"については、こちらでは"Jammu and Kashmir"となっていましたので、コードも修正しています。
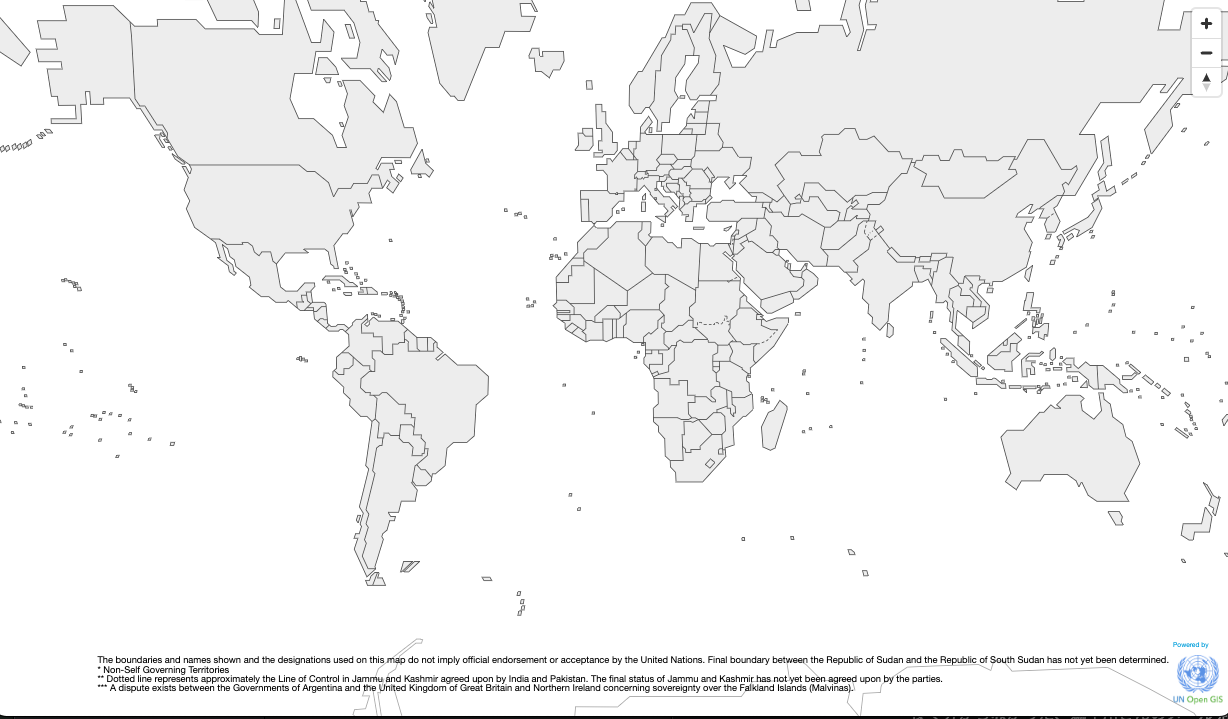
Maplibre GL JSで地図を表示
次にMaplibre GL JSで地図を表示します。
作成した地図はこちらで見られます。
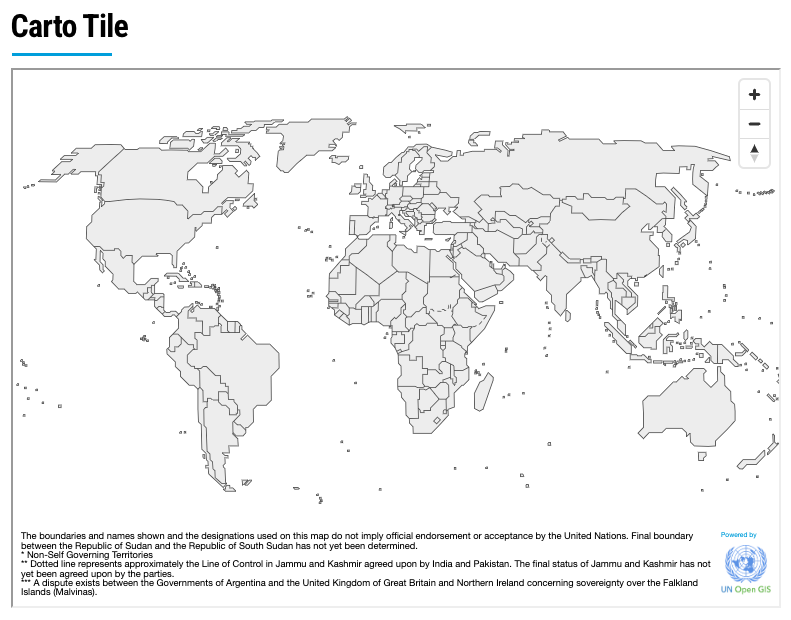
※ベクトルタイルの投影法
ベクトルタイルはWebメルカトルと呼ばれる投影法によって表示されています。EPSGは3857です。ベクトルタイルを作成する際には、基本的にはtippecanoeを利用しますが、その際のインプットデータはデフォルトではWGS84(EPSG:4326)です。アウトプットデータはWebメルカトル(EPSG:3857)となります。Carto Mapは以下のとおり、WGS84(EPSG:4326)の見た目だったので、tippecanoeやGDALを利用して、WGS84の投影法に変換できるのか調べてみましたが、出来ないようでした。Carto Mapの元データが最初からWebメルカトル(EPSG:3857)であり、それをそのまま素直にベクトルタイルにしたものがCarto Mapではないかと思われます。
※追記
Dirty Reprojectorsというツールを利用するとWebメルカトルではない形で出力出来ます。
まとめ
Carto Tile地図をMaputnikとMaplibre GL JSを用いて作成しました。ポップアップ表示の部分はif文を多用しており複雑に見えますが、構造はシンプルです。地図の投影法はなかなか理解するのが難しいですが、記事作成を通して、ベクトルタイルはやはりWebメルカトル(EPSG:3857)として表示されるのだと再認識しました。
Reference