はじめに
こちらの記事で作成したベクトルタイルを地図上に表示したいと考え、そのために必要なスタイファイルの作成手順を説明します。Maputnikを使用します。
Maputnikを使用したスタイルファイルの作成手順
ベクトルタイルの読み込み
Maputnikを開いたら、「Data Sources」 > 「Add New Srouce」に以下の通り入力してベクトルタイルを読み込みます。
| プロパティ | 値 | 説明 |
|---|---|---|
| Source ID | v | 任意の値 |
| Source Type | Vector(XYZ URLs) | 既定値 |
| Tile URL | https://k96mz.github.io/makeVectorTiles/Data/VTpractice/{z}/{x}/{y}.pbf | ベクトルタイルのURL |
| Min Zoom | 0 | 最小ズーム値 |
| Max Zoom | 4 | 最大ズーム値 |
Source Typeは、Vector(XYZ URLs)とありますが、Tile URLは、{z}/{x}/{y}の順番となることに注意してください。
GitHubに格納しているベクトルタイルを読み込みますので、GitHub Pagesの設定でベクトルタイルを公開している必要があります。
スタイルを作成する
次にスタイルファイルを作成します。「Add Layer」から以下の通り入力します。
◯海岸線
ID: coastl(任意の値、今回はSource Layerと同じ名前とした)
Type: Line(データタイプが線であるため)
Source: v(先ほど追加したソースを指定)
Source Layer: coastl(ベクトルタイル作成時に指定したレイヤの名称を記載)
◯陸域
ID: landmass
Type: Fill(データタイプが面であるため)
Source: v
Source Layer: landmass(ベクトルタイル作成時に指定したレイヤの名称を記載)
color:rgba(195, 176, 176, 1) (適当に値を指定した)
◯河川
ID: riverl
Type: Line
Source: v
Source Layer: riverl(ベクトルタイル作成時に指定したレイヤの名称を記載)
color: blue
width: 2
作成したスタイルファイルは、「Export」 > 「Download Style」でダウンロード出来ます。
ダウンロードされたスタイルファイルは以下です。
{
  "version": 8,
  "name": "Empty Style",
  "metadata": {"maputnik:renderer": "mlgljs"},
  "sources": {
    "v": {
      "type": "vector",
      "tiles": [
        "https://k96mz.github.io/makeVectorTiles/Data/VTpractice/{z}/{x}/{y}.pbf"
      ],
      "minzoom": 0,
      "maxzoom": 4
    }
  },
  "sprite": "",
  "glyphs": "https://orangemug.github.io/font-glyphs/glyphs/{fontstack}/{range}.pbf",
  "layers": [
    {
      "id": "coastl",
      "type": "line",
      "source": "v",
      "source-layer": "coastl",
      "maxzoom": 5
    },
    {
      "id": "landmass",
      "type": "fill",
      "source": "v",
      "source-layer": "landmass",
      "maxzoom": 5,
      "paint": {"fill-color": "rgba(195, 176, 176, 1)"}
    },
    {
      "id": "riverl",
      "type": "line",
      "source": "v",
      "source-layer": "riverl",
      "maxzoom": 5,
      "paint": {"line-color": "blue", "line-width": 2}
    }
  ],
  "id": "dsyugj9"
}
スタイリングをした地図は、こちらのMaputnikのリンクから見られます。
MapLibre GL JSで表示する
MaplLibre GL JSのExampleのページで紹介されているコードを使用します。
<!DOCTYPE html>
<html lang="en">
  <head>
    <title>Display a map</title>
    <meta
      property="og:description"
      content="Initialize a map in an HTML element with MapLibre GL JS."
    />
    <meta charset="utf-8" />
    <meta name="viewport" content="width=device-width, initial-scale=1" />
    <link
      rel="stylesheet"
      href="https://unpkg.com/maplibre-gl@4.5.0/dist/maplibre-gl.css"
    />
    <script src="https://unpkg.com/maplibre-gl@4.5.0/dist/maplibre-gl.js"></script>
    <style>
      body {
        margin: 0;
        padding: 0;
      }
      html,
      body,
      #map {
        height: 100%;
      }
    </style>
  </head>
  <body>
    <div id="map"></div>
    <script>
      const map = new maplibregl.Map({
        container: "map", // container id
        style:
          "https://k96mz.github.io/makeVectorTiles/style/download_style.json", // style URL
        center: [0, 0], // starting position [lng, lat]
        zoom: 1, // starting zoom
        maplibreLogo: true,
        hash: true,
      });

      //UI
      map.addControl(new maplibregl.NavigationControl(), "bottom-right");
      map.addControl(new maplibregl.ScaleControl());

      //debug
      map.showTileBoundaries = true;
      map.showCollisionBoxes = false;
    </script>
  </body>
</html>
サンプルコードのスタイルファイルの参照先は変更しています。
また、hash, UI, debugの記述も追記しています。
作成した地図はこちらで見られます。
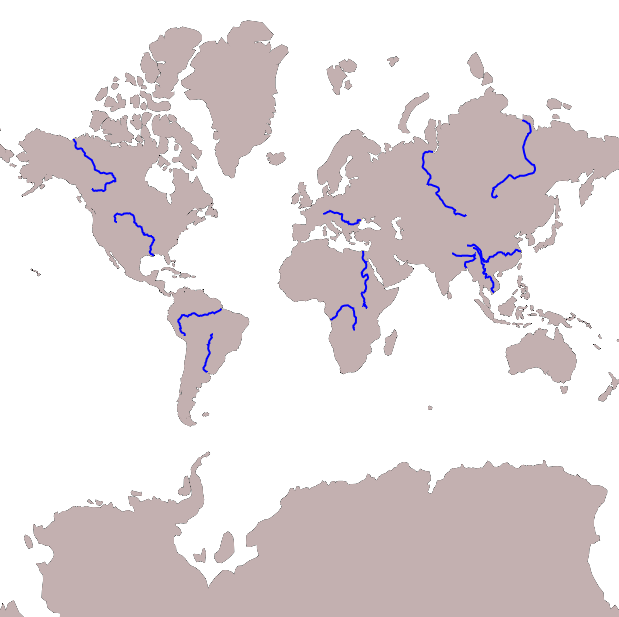
Tippecanoeは、デフォルトで入力データの投影法をEPSG:4326(WGS84)とみなし、作成されるベクトルタイルは自動的にEPSG:3857(Web Mercator)に変換されます。そのため、作成された地図は、以下のように高緯度のグリーンランドなどが大きく表示されています。
下図は、入力データの投影法EPSG:4326(WGS84)ですが、違いが大きいですね。
Reference


