1. Logstashの導入(インストール&基本設定)
ダウンロード
以下のurlよりダウンロードしてくる
https://www.elastic.co/jp/downloads/past-releases/logstash-7-10-0
解凍
解凍する。
tar -zxvf logstash-7.10.0-linux-x86_64.tar.gz
設定ファイル(logstash.yml)の設定
Elasticsearchにxpackを導入していないのであれば、デフォルトで問題ない。
Elasticsearchにxpackを導入している場合、下記の設定が必要
xpack.monitoring.elasticsearch.hosts: [ "http://localhost:9200" ]
xpack.monitoring.elasticsearch.username: logstash_system
xpack.monitoring.elasticsearch.password: password99
設定ファイルを開いて、上記の設定を追加する
cd /logstash-7.10.0/config
vi logstash.yml
設定追加後のlogstash.yml
(こちらを開く)
# Settings file in YAML
#
# Settings can be specified either in hierarchical form, e.g.:
#
#   pipeline:
#     batch:
#       size: 125
#       delay: 5
#
# Or as flat keys:
#
#   pipeline.batch.size: 125
#   pipeline.batch.delay: 5
#
# ------------  Node identity ------------
#
# Use a descriptive name for the node:
#
# node.name: test
#
# If omitted the node name will default to the machine's host name
#
# ------------ Data path ------------------
#
# Which directory should be used by logstash and its plugins
# for any persistent needs. Defaults to LOGSTASH_HOME/data
#
# path.data:
#
# ------------ Pipeline Settings --------------
#
# The ID of the pipeline.
#
# pipeline.id: main
#
# Set the number of workers that will, in parallel, execute the filters+outputs
# stage of the pipeline.
#
# This defaults to the number of the host's CPU cores.
#
# pipeline.workers: 2
#
# How many events to retrieve from inputs before sending to filters+workers
#
# pipeline.batch.size: 125
#
# How long to wait in milliseconds while polling for the next event
# before dispatching an undersized batch to filters+outputs
#
# pipeline.batch.delay: 50
#
# Force Logstash to exit during shutdown even if there are still inflight
# events in memory. By default, logstash will refuse to quit until all
# received events have been pushed to the outputs.
#
# WARNING: enabling this can lead to data loss during shutdown
#
# pipeline.unsafe_shutdown: false
#
# Set the pipeline event ordering. Options are "auto" (the default), "true" or "false".
# "auto" will  automatically enable ordering if the 'pipeline.workers' setting
# is also set to '1'.
# "true" will enforce ordering on the pipeline and prevent logstash from starting
# if there are multiple workers.
# "false" will disable any extra processing necessary for preserving ordering.
#
pipeline.ordered: auto
#
# ------------ Pipeline Configuration Settings --------------
#
# Where to fetch the pipeline configuration for the main pipeline
#
# path.config:
#
# Pipeline configuration string for the main pipeline
#
# config.string:
#
# At startup, test if the configuration is valid and exit (dry run)
#
# config.test_and_exit: false
#
# Periodically check if the configuration has changed and reload the pipeline
# This can also be triggered manually through the SIGHUP signal
#
# config.reload.automatic: false
#
# How often to check if the pipeline configuration has changed (in seconds)
# Note that the unit value (s) is required. Values without a qualifier (e.g. 60)
# are treated as nanoseconds.
# Setting the interval this way is not recommended and might change in later versions.
#
# config.reload.interval: 3s
#
# Show fully compiled configuration as debug log message
# NOTE: --log.level must be 'debug'
#
# config.debug: false
#
# When enabled, process escaped characters such as \n and \" in strings in the
# pipeline configuration files.
#
# config.support_escapes: false
#
# ------------ HTTP API Settings -------------
# Define settings related to the HTTP API here.
#
# The HTTP API is enabled by default. It can be disabled, but features that rely
# on it will not work as intended.
# http.enabled: true
#
# By default, the HTTP API is bound to only the host's local loopback interface,
# ensuring that it is not accessible to the rest of the network. Because the API
# includes neither authentication nor authorization and has not been hardened or
# tested for use as a publicly-reachable API, binding to publicly accessible IPs
# should be avoided where possible.
#
# http.host: 127.0.0.1
#
# The HTTP API web server will listen on an available port from the given range.
# Values can be specified as a single port (e.g., `9600`), or an inclusive range
# of ports (e.g., `9600-9700`).
#
# http.port: 9600-9700
#
# ------------ Module Settings ---------------
# Define modules here.  Modules definitions must be defined as an array.
# The simple way to see this is to prepend each `name` with a `-`, and keep
# all associated variables under the `name` they are associated with, and
# above the next, like this:
#
# modules:
#   - name: MODULE_NAME
#     var.PLUGINTYPE1.PLUGINNAME1.KEY1: VALUE
#     var.PLUGINTYPE1.PLUGINNAME1.KEY2: VALUE
#     var.PLUGINTYPE2.PLUGINNAME1.KEY1: VALUE
#     var.PLUGINTYPE3.PLUGINNAME3.KEY1: VALUE
#
# Module variable names must be in the format of
#
# var.PLUGIN_TYPE.PLUGIN_NAME.KEY
#
# modules:
#
# ------------ Cloud Settings ---------------
# Define Elastic Cloud settings here.
# Format of cloud.id is a base64 value e.g. dXMtZWFzdC0xLmF3cy5mb3VuZC5pbyRub3RhcmVhbCRpZGVudGlmaWVy
# and it may have an label prefix e.g. staging:dXMtZ...
# This will overwrite 'var.elasticsearch.hosts' and 'var.kibana.host'
# cloud.id: <identifier>
#
# Format of cloud.auth is: <user>:<pass>
# This is optional
# If supplied this will overwrite 'var.elasticsearch.username' and 'var.elasticsearch.password'
# If supplied this will overwrite 'var.kibana.username' and 'var.kibana.password'
# cloud.auth: elastic:<password>
#
# ------------ Queuing Settings --------------
#
# Internal queuing model, "memory" for legacy in-memory based queuing and
# "persisted" for disk-based acked queueing. Defaults is memory
#
# queue.type: memory
#
# If using queue.type: persisted, the directory path where the data files will be stored.
# Default is path.data/queue
#
# path.queue:
#
# If using queue.type: persisted, the page data files size. The queue data consists of
# append-only data files separated into pages. Default is 64mb
#
# queue.page_capacity: 64mb
#
# If using queue.type: persisted, the maximum number of unread events in the queue.
# Default is 0 (unlimited)
#
# queue.max_events: 0
#
# If using queue.type: persisted, the total capacity of the queue in number of bytes.
# If you would like more unacked events to be buffered in Logstash, you can increase the
# capacity using this setting. Please make sure your disk drive has capacity greater than
# the size specified here. If both max_bytes and max_events are specified, Logstash will pick
# whichever criteria is reached first
# Default is 1024mb or 1gb
#
# queue.max_bytes: 1024mb
#
# If using queue.type: persisted, the maximum number of acked events before forcing a checkpoint
# Default is 1024, 0 for unlimited
#
# queue.checkpoint.acks: 1024
#
# If using queue.type: persisted, the maximum number of written events before forcing a checkpoint
# Default is 1024, 0 for unlimited
#
# queue.checkpoint.writes: 1024
#
# If using queue.type: persisted, the interval in milliseconds when a checkpoint is forced on the head page
# Default is 1000, 0 for no periodic checkpoint.
#
# queue.checkpoint.interval: 1000
#
# ------------ Dead-Letter Queue Settings --------------
# Flag to turn on dead-letter queue.
#
# dead_letter_queue.enable: false

# If using dead_letter_queue.enable: true, the maximum size of each dead letter queue. Entries
# will be dropped if they would increase the size of the dead letter queue beyond this setting.
# Default is 1024mb
# dead_letter_queue.max_bytes: 1024mb

# If using dead_letter_queue.enable: true, the interval in milliseconds where if no further events eligible for the DLQ
# have been created, a dead letter queue file will be written. A low value here will mean that more, smaller, queue files
# may be written, while a larger value will introduce more latency between items being "written" to the dead letter queue, and
# being available to be read by the dead_letter_queue input when items are are written infrequently.
# Default is 5000.
#
# dead_letter_queue.flush_interval: 5000

# If using dead_letter_queue.enable: true, the directory path where the data files will be stored.
# Default is path.data/dead_letter_queue
#
# path.dead_letter_queue:
#
# ------------ Metrics Settings --------------
#
# Bind address for the metrics REST endpoint
#
# http.host: "127.0.0.1"
#
# Bind port for the metrics REST endpoint, this option also accept a range
# (9600-9700) and logstash will pick up the first available ports.
#
# http.port: 9600-9700
#
# ------------ Debugging Settings --------------
#
# Options for log.level:
#   * fatal
#   * error
#   * warn
#   * info (default)
#   * debug
#   * trace
#
# log.level: info
# path.logs:
#
# ------------ Other Settings --------------
#
# Where to find custom plugins
# path.plugins: []
#
# Flag to output log lines of each pipeline in its separate log file. Each log filename contains the pipeline.name
# Default is false
# pipeline.separate_logs: false
#
# ------------ X-Pack Settings (not applicable for OSS build)--------------
#
# X-Pack Monitoring
# https://www.elastic.co/guide/en/logstash/current/monitoring-logstash.html
#xpack.monitoring.enabled: false
#xpack.monitoring.elasticsearch.username: logstash_system
#xpack.monitoring.elasticsearch.password: password
#xpack.monitoring.elasticsearch.proxy: ["http://proxy:port"]
#xpack.monitoring.elasticsearch.hosts: ["https://es1:9200", "https://es2:9200"]
# an alternative to hosts + username/password settings is to use cloud_id/cloud_auth
#xpack.monitoring.elasticsearch.cloud_id: monitoring_cluster_id:xxxxxxxxxx
#xpack.monitoring.elasticsearch.cloud_auth: logstash_system:password
# another authentication alternative is to use an Elasticsearch API key
#xpack.monitoring.elasticsearch.api_key: "id:api_key"
#xpack.monitoring.elasticsearch.ssl.certificate_authority: [ "/path/to/ca.crt" ]
#xpack.monitoring.elasticsearch.ssl.truststore.path: path/to/file
#xpack.monitoring.elasticsearch.ssl.truststore.password: password
#xpack.monitoring.elasticsearch.ssl.keystore.path: /path/to/file
#xpack.monitoring.elasticsearch.ssl.keystore.password: password
#xpack.monitoring.elasticsearch.ssl.verification_mode: certificate
#xpack.monitoring.elasticsearch.sniffing: false
#xpack.monitoring.collection.interval: 10s
#xpack.monitoring.collection.pipeline.details.enabled: true

xpack.monitoring.elasticsearch.hosts: [ "http://localhost:9200" ]
xpack.monitoring.elasticsearch.username: logstash_system
xpack.monitoring.elasticsearch.password: password99


#
# X-Pack Management
# https://www.elastic.co/guide/en/logstash/current/logstash-centralized-pipeline-management.html
#xpack.management.enabled: false
#xpack.management.pipeline.id: ["main", "apache_logs"]
#xpack.management.elasticsearch.username: logstash_admin_user
#xpack.management.elasticsearch.password: password
#xpack.management.elasticsearch.proxy: ["http://proxy:port"]
#xpack.management.elasticsearch.hosts: ["https://es1:9200", "https://es2:9200"]
# an alternative to hosts + username/password settings is to use cloud_id/cloud_auth
#xpack.management.elasticsearch.cloud_id: management_cluster_id:xxxxxxxxxx
#xpack.management.elasticsearch.cloud_auth: logstash_admin_user:password
# another authentication alternative is to use an Elasticsearch API key
#xpack.management.elasticsearch.api_key: "id:api_key"
#xpack.management.elasticsearch.ssl.certificate_authority: [ "/path/to/ca.crt" ]
#xpack.management.elasticsearch.ssl.truststore.path: /path/to/file
#xpack.management.elasticsearch.ssl.truststore.password: password
#xpack.management.elasticsearch.ssl.keystore.path: /path/to/file
#xpack.management.elasticsearch.ssl.keystore.password: password
#xpack.management.elasticsearch.ssl.verification_mode: certificate
#xpack.management.elasticsearch.sniffing: false
#xpack.management.logstash.poll_interval: 5s
2. データ連携
2-1. CSVデータの場合
連携用CSVファイルを準備する
ここでは2ファイル準備する
Id,Title,Context,UserId,UpdateDate
0001,This section is Title1.,This section is context1.,1,2023-09-11 10:00:00
0002,This section is Title2.,This section is context2.,1,2023-09-11 11:00:00
Id,Title,Context,UserId,UpdateDate
0003,This section is Title3.,This section is context4.,3,2023-09-11 12:00:00
0004,This section is Title4.,This section is context3.,4,2023-09-11 13:00:00
取込用の設定ファイルを準備する
ファイル名は任意指定可能(ここでは、logstash_forCSV.confで記載している)
filter => columns はCSVファイルの項目名と一致させること
filter {
    csv {
        columns => ["Id", "Title", "Context","UserId","UpdateDate"]
        convert => {
            "UserId" => "integer"
        }
        skip_header => true
    }
    date {
        match => ["UpdateDate", "yyyy-MM-dd HH:mm:ss"]
    }
}
output => elasticsearch => user は"elastic"を指定すること
output {
    elasticsearch {

        hosts => ["http://localhost:9200"]
        action => "update"
        index => "test"
        doc_as_upsert => true
        document_id => "%{doc_id}"
        user => "elastic"
        password => "password99"
    }
    stdout {
        codec => rubydebug
    }
}
_idを指定したい場合、👇の3項目を設定する
        action => "update"
        doc_as_upsert => true
        document_id => "%{doc_id}"
sample:CSV連携用の設定ファイル
logstash_csv.conf(ここを開く)
input {
    file {
        mode => "tail"
        path => ["/home/hoge/work/testData/*_test.csv"]
        sincedb_path => "/home/hoge/local_dev/logstash-7.10.0/log/sincedb"
        start_position => "beginning"
        codec => plain {
            charset => "UTF-8"
        }
    }
}

filter {
    csv {
        columns => ["Id", "Title", "Context","UserId","UpdateDate"]
        convert => {
            "UserId" => "integer"
        }
        skip_header => true
    }
    date {
        match => ["UpdateDate", "yyyy-MM-dd HH:mm:ss"]
    }
}

output {
    elasticsearch {

        hosts => ["http://localhost:9200"]
        action => "update"
        index => "test"
        doc_as_upsert => true
        document_id => "%{doc_id}"
        user => "elastic"
        password => "password99"
    }
    stdout {
        codec => rubydebug
    }
}
2-2. postgresの場合
postgre用のjdbcを準備する
https://jdbc.postgresql.org/download/
取込用の設定ファイルを準備する
ファイル名は任意指定可能(ここでは、logstash_postgres.confで記載している)
input => jdbc にposrgreの接続情報やSQLを記載する
input {
  jdbc {
    jdbc_driver_library => ["/home/hogehoge/logstash-7.10.0/lib/postgreJDBC/42.6.0/postgresql-42.6.0.jar"]
    jdbc_driver_class => "org.postgresql.Driver"
    jdbc_connection_string => "jdbc:postgresql://localhost:5432/dbname"
    jdbc_user => "user"
    jdbc_password => "password"

    tracking_column => "updated_at"
    use_column_value => true
    tracking_column_type => "timestamp"
    schedule => "*/10 * * * * *"

    statement => "
      SELECT col_uk, col1,col2,col3
      FROM test_table
    "
  }
}
output => elasticsearch => user は"elastic"を指定すること
document_idを指定したい場合は、%{カラム名}で設定する
output {
    elasticsearch {

        hosts => ["http://localhost:9200"]
        action => "update"
        index => "test_index"
        doc_as_upsert => true
        document_id => "%{col_uk}"
        user => "elastic"
        password => "password99"

    }
    stdout {
        codec => rubydebug
    }
}
sample:postgre連携用の設定ファイル
logstash_postgre.conf(ここを開く)
input {
  jdbc {
    jdbc_driver_library => ["/home/hogehoge/logstash-7.10.0/lib/postgreJDBC/42.6.0/postgresql-42.6.0.jar"]
    jdbc_driver_class => "org.postgresql.Driver"
    jdbc_connection_string => "jdbc:postgresql://localhost:5432/dbname"
    jdbc_user => "user"
    jdbc_password => "password"

    tracking_column => "updated_at"
    use_column_value => true
    tracking_column_type => "timestamp"
    schedule => "*/10 * * * * *"

    statement => "
      SELECT col_uk, col1,col2,col3
      FROM test_table
    "
  }
}
filter {
}

output {
    elasticsearch {

        hosts => ["http://localhost:9200"]
        action => "update"
        index => "test_index"
        doc_as_upsert => true
        document_id => "%{col_uk}"
        user => "elastic"
        password => "password99"

    }
    stdout {
        codec => rubydebug
    }
}
3. 実行
logstashディレクトリにて実行する(※実行対象の設定ファイルを引数として渡す)
bin/logstash -f config/logstash_postgre.conf
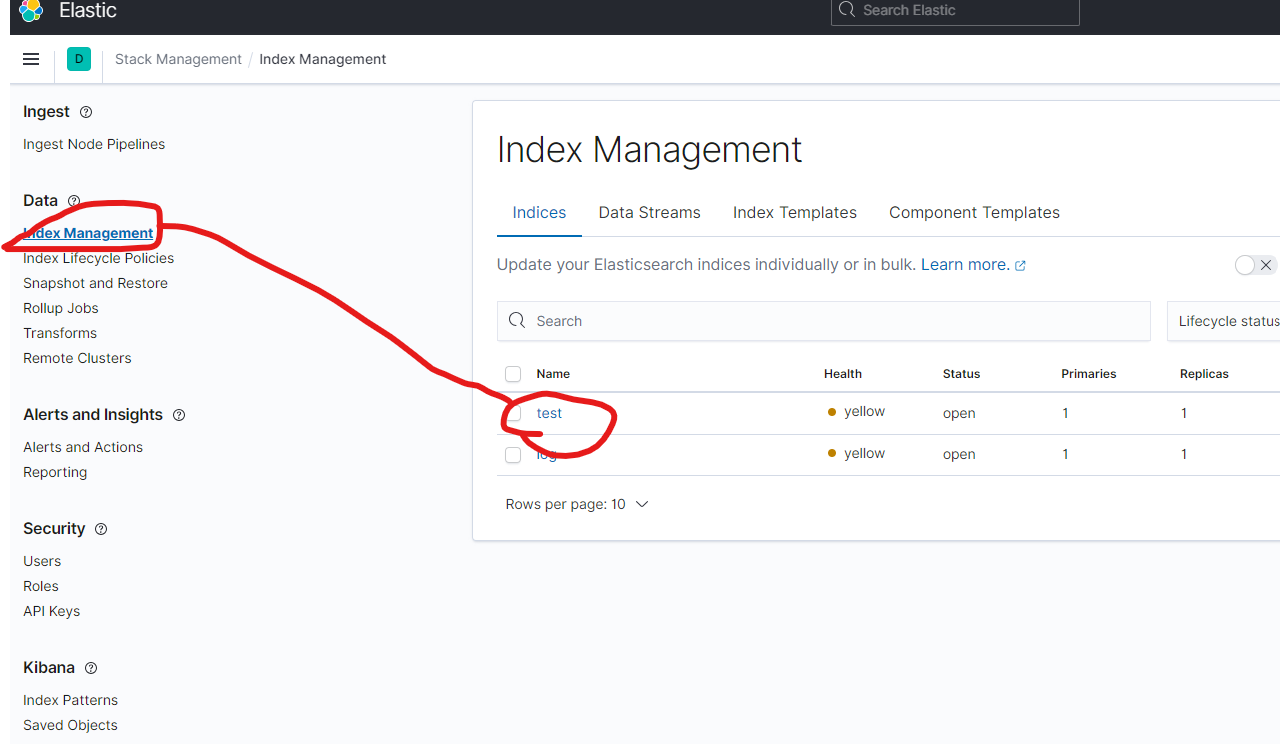
4.確認方法
kibana を起動する
http://(kibana-URL):5601/app/home#/
1.StackManagementを選択する
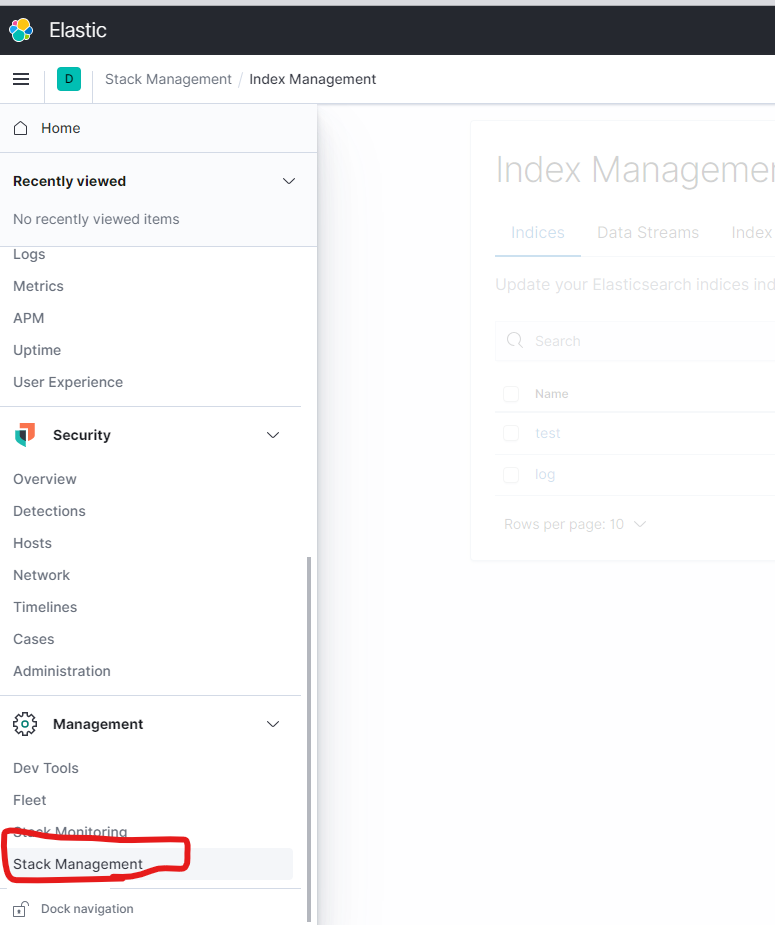
2.IndexManagementを選択して、indexができていることを確認する