はじめに
この記事は株式会社ACCESSのAdvent Calendar 2019の21日目の記事です。
弊社のとある案件で、非線形最小二乗法フィッティングをすることになるはずなので、その予習の為に、以前使ったことのあるlmfitによる非線形最小二乗法フィッティングを復習して、ここにまとめます。
lmfit
lmfitとは、"Non-Linear Least-Squares Minimization and Curve-Fitting for Python"と公式のサブタイトルがある通り非線形最小二乗法を用いたモデルフィットのためのライブラリで、scipy.optimizeの多くの最適化方法を基にして拡張し、開発されている。
特長
以下特長が挙げられている。
- Parameter クラスオブジェクトの導入。これにより、モデルのパラメータの扱いが容易になる。
- モデルフィッティングのアルゴリズムの変更のしやすさ。
- パラメータの信頼区間推定の改善。scipy.optimize.leastsqのものに比べて、簡潔に信頼区間推定ができるようになっている。
-
Modelクラスオブジェクトを使用することで、カーブフィットが改善されている。この
Modelクラスオブジェクトは、scipy.optimize.curve_fitの機能を拡張している。 - 一般的な線形の多くのビルドインモデルが用意されていて、すぐに使用できる。
(主観的に)便利だと思うところ
- モデルとモデルのパラメータの扱いやすさ
- 自分で定義したモデルフィッティングで使いたい関数を簡単に導入できる。
- モデルのパラメータへのアクセスがPythonのdictionaryの機能で容易にできる。
- パラメータの境界/固定の設定が容易にできる。
フィッティングするときにパラメータの最適値を探す範囲の設定や、パラメータの値を固定にする(フリーパラメータでなくす)ことが容易にできる。 - 目的関数を変更することなく、パラメータを修正できる。
- パラメータに代数的に制約を与えられる。
他のパラメータとの関係を制限できる。
lmfitでモデルフィッティング
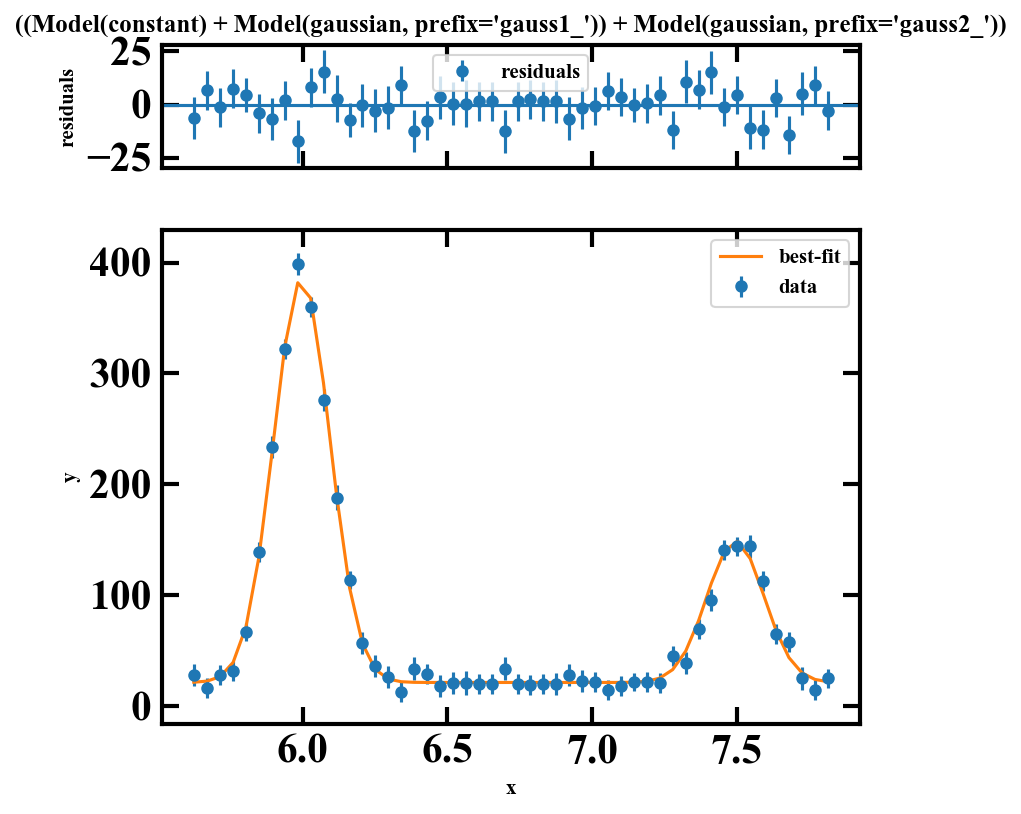
データは、この記事用に作成したもので、プロットすると以下のようになっています。

ぱっと見てわかるように、このデータには2つの構造があって、6.0 と7.5 あたりに、正規分布ような構造が見える。
このデータをフィッティングしてみる。
モデル
上でも述べたように、2つの正規分布ような構造があるので、これらを表すモデルを導入する必要がある。また、0ではない一定なオフセットがあるように見えるので、これを再現する成分もモデルに組み込む必要がある。式に表すと以下のとおり。
f\left( x \right) = G_1 \left( x \right) + G_2 \left( x \right) + C
これをlmfit.modelsクラスオブジェクトを用いて表すと以下のようになる。
import lmfit as lf
import lmfit.models as lfm

# モデルの定義
model = lfm.ConstantModel() +  lfm.GaussianModel(prefix='gauss1_') + lfm.GaussianModel(prefix='gauss2_')
prefixを指定することで、同じモデル関数を用いていても、パラメータの区別がつけられるので便利。
自前のモデルを導入する場合
Modelクラスオブジェクトに定義した関数を渡せば一発で、導入可能。
def constant(x, const):
    return const

model = lf.Model(constant) +  lfm.GaussianModel(prefix='gauss1_') + lfm.GaussianModel(prefix='gauss2_')
パラメータ
Modelクラスオブジェクトを宣言しても、そのModelクラスオブジェクトに対する、Parametersクラスオブジェクトは宣言されないので、まずはその宣言からする。
# 各パラメータの初期値等を設定
par_val = {
    'c' : 20,
    'const' : 20,
    'gauss1_center' : 6.0,
    'gauss1_sigma' : 1.0,
    'gauss1_amplitude' : 400,
    'gauss2_center' : 7.5,
    'gauss2_sigma' : 1.0,
    'gauss2_amplitude' : 150
}

par_min = {
    'c' : 0,
    'const' : 0,
    'gauss1_center' : 0,
    'gauss1_sigma' : 0,
    'gauss1_amplitude' : 0,
    'gauss2_center' : 0,
    'gauss2_sigma' : 0,
    'gauss2_amplitude' : 0
}

par_max = {
    'c' : 100,
    'const' : 100,
    'gauss1_center' : 10,
    'gauss1_sigma' : 10,
    'gauss1_amplitude' : 1000,
    'gauss2_center' : 10,
    'gauss2_sigma' : 10,
    'gauss2_amplitude' : 1000
}

par_vary = {
    'c' : True,
    'const' : True,
    'gauss1_center' : True,
    'gauss1_sigma' : True,
    'gauss1_amplitude' : True,
    'gauss2_center' : True,
    'gauss2_sigma' : True,
    'gauss2_amplitude' : True
}

# 定義したモデル用のParameters クラスオブジェクトの宣言
params = model.make_params()
for name in model.param_names:
    params[name].set(
        value=par_val[name], # 初期値
        min=par_min[name], # 下限値
        max=par_max[name], # 上限値
        vary=par_vary[name] # パラメータを動かすかどうか
    )
以下のようにして、パラメータ同士の関係を代数的に制約を与えられる。
params['gauss2_center'].set(expr='gauss1_center*1.25')
フィッティング
result = model.fit(x=df.x, data=df.y, weights=df.dy**(-1.0), params=params, method='leastsq')
注意: データはpandasのDataFrameオブジェクトで与えている。
フィッティング結果の確認
-
summary
print(result.fit_report())以下のように、フィッティング結果のまとめを見ることができる。
[[Model]] ((Model(constant) + Model(gaussian, prefix='gauss1_')) + Model(gaussian, prefix='gauss2_')) [[Fit Statistics]] # fitting method = leastsq # function evals = 383 # data points = 50 # variables = 6 chi-square = 29.2390839 reduced chi-square = 0.66452463 Akaike info crit = -14.8258350 Bayesian info crit = -3.35369698 [[Variables]] const: 21.4200227 +/- 1.47331527 (6.88%) (init = 20) gauss1_amplitude: 88.4566498 +/- 1.39004141 (1.57%) (init = 400) gauss1_center: 5.99651706 +/- 0.00136123 (0.02%) (init = 6) gauss1_sigma: 0.09691089 +/- 0.00153157 (1.58%) (init = 1) gauss2_amplitude: 31.6555368 +/- 1.39743186 (4.41%) (init = 150) gauss2_center: 7.49564632 +/- 0.00170154 (0.02%) == 'gauss1_center*1.25' gauss2_sigma: 0.09911853 +/- 0.00446584 (4.51%) (init = 1) gauss1_fwhm: 0.22820770 +/- 0.00360656 (1.58%) == '2.3548200*gauss1_sigma' gauss1_height: 364.139673 +/- 4.89553113 (1.34%) == '0.3989423*gauss1_amplitude/max(2.220446049250313e-16, gauss1_sigma)' gauss2_fwhm: 0.23340629 +/- 0.01051624 (4.51%) == '2.3548200*gauss2_sigma' gauss2_height: 127.410415 +/- 4.77590041 (3.75%) == '0.3989423*gauss2_amplitude/max(2.220446049250313e-16, gauss2_sigma)' [[Correlations]] (unreported correlations are < 0.100) C(gauss2_amplitude, gauss2_sigma) = 0.647 C(gauss1_amplitude, gauss1_sigma) = 0.636 C(const, gauss2_amplitude) = -0.555 C(const, gauss1_amplitude) = -0.552 C(const, gauss1_sigma) = -0.367 C(const, gauss2_sigma) = -0.359 C(gauss1_amplitude, gauss2_amplitude) = 0.306 C(gauss1_sigma, gauss2_amplitude) = 0.203 C(gauss1_amplitude, gauss2_sigma) = 0.198 C(gauss1_sigma, gauss2_sigma) = 0.131 -
confidence interval
print('[[Confidence Intervals]]')
print(result.ci_report())
[[Confidence Intervals]] 99.73% 95.45% 68.27% _BEST_ 68.27% 95.45% 99.73% const : -4.72534 -3.05035 -1.49522 21.42002 +1.48820 +3.02111 +4.65531 gauss1_amplitude: -4.37979 -2.84434 -1.40305 88.45665 +1.41243 +2.88513 +4.47133 gauss1_center : -0.00435 -0.00278 -0.00131 5.99652 +0.00131 +0.00278 +0.00436 gauss1_sigma : -0.00479 -0.00312 -0.00154 0.09691 +0.00156 +0.00321 +0.00499 gauss2_amplitude: -4.31612 -2.82491 -1.40294 31.65554 +1.43259 +2.94767 +4.61057 gauss2_sigma : -0.01344 -0.00889 -0.00446 0.09912 +0.00466 +0.00971 +0.01540 -
フィッティング結果のプロット
fig, gridspec = result.plot(data_kws={'markersize': 5}) -
フィッティング結果
最適値の値等は以下のプロパティが持っているので、あとはご自由にどうぞ。result.chisqr # カイ自乗値 result.nfree # 自由度 result.redchi # 換算カイ自乗値 result.aic # aic result.bic # bic result.best_fit # best-fit modelの値 (フィッティング結果のオレンジ色のプロットの値) result.residual # (best-fit model)-(data)の値 (フィッティング結果の上側のパネルの値) result.eval_components(x=df.x) # best-fit modelの成分ごとの値 result.best_values # 各パラメータの最適値: dict型 result.result.params['const'].value # パラメータの最適値 result.result.params['const'].stderr # パラメータの標準誤差
以上。引き続き、22日目の、@rheza_hの記事をお楽しみください。
