はじめに
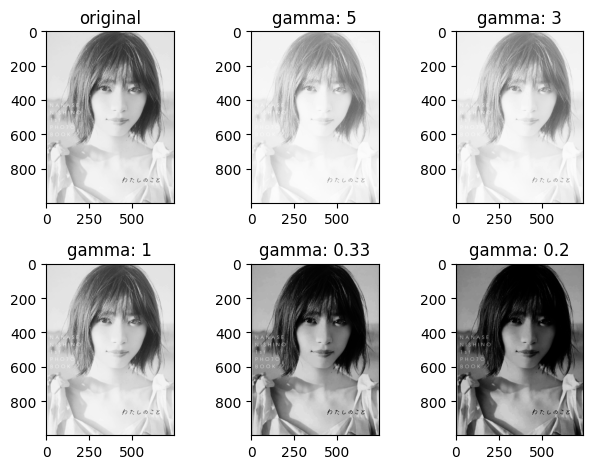
※今回のサンプル画像として、乃木坂46の西野七瀬さんの写真を使用します。元がいい写真なので、今回の処理は蛇足です。

画素値を補正する手法の一つにガンマ補正、コントラスト強調/低減があります。画素値の補正を行うことで、画像の印象を変更することができます。自身の理解を深めるために技術記事を書きます。n番煎じです。OpenCVによる画像処理入門 改訂第3版を参考に実装しました。
ガンマ補正
計算方法
以下のような画素値を変更させる関数をガンマ関数といいます。この時、入力の画素値を $I_{src}$ 、出力の画素値を $I_{dst}$ とします。
I_{dst} = 255 \times (\frac{I_{src}}{255}) ^ {1/\gamma}
$\gamma$ の値を変えたガンマ関数に対し、$0$ から$255$ の任意の値を入力した際の出力値を以下に示します。

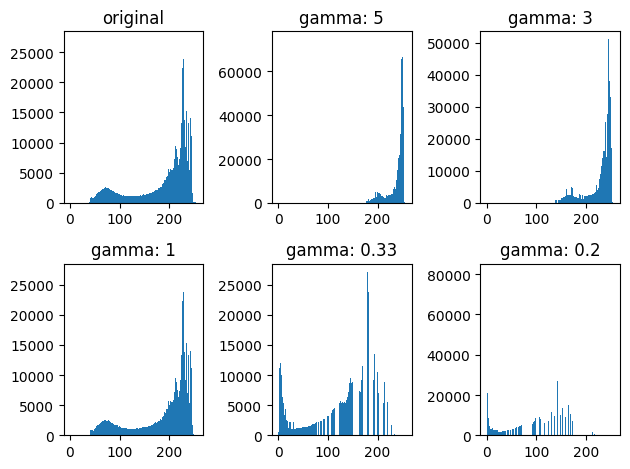
上記の入出力をみるとわかるように、$\gamma$ の値をいじることで、画像内の暗い箇所を明るく、または明るい箇所を暗く変換することが可能です。例えば、$\gamma = 5$ の画像では画像内の暗い(=画素値が小さい)部位の画素値を大きくすることで、画像を明るく変換します。


実装
import cv2
import matplotlib.pyplot as plt
import numpy as np

path = r"your_directory_path"
name_img = r"\nishino_1.jpg"
path_img = path + name_img
img = cv2.imread(path_img)
img_g = cv2.cvtColor(img_rgb, cv2.COLOR_BGR2GRAY)

# gamma_correction
def gamma_correction(value, gamma):
    converted_value = 255 * pow((value/255), 1/gamma)

    return converted_value


gamma = [5,3,1,0.33, 0.2]

fig, axes = plt.subplots(2,3, tight_layout=True)
axes = axes.flatten()
axes[0].imshow(img_g, cmap = "gray")
axes[0].set_title("original")

fig2, axes2 =  plt.subplots(2,3, tight_layout=True)
axes2 = axes2.flatten()
axes2[0].hist(img_g.ravel(), 256, [0,256])
axes2[0].set_title("original")

for ax, g in enumerate(gamma):

    gamma_image = np.zeros(img_g.size).reshape(img_g.shape)
    for i in range(gamma_image.shape[0]):
        for j in range(gamma_image.shape[1]):
            gamma_image[i,j] = gamma_correction(img_g[i,j], g)

    axes[ax+1].imshow(gamma_image, cmap = "gray")
    axes[ax+1].set_title(f"gamma: {g}")

    axes2[ax+1].hist(gamma_image.ravel(), 256, [0,256], label = "numpy")
    # calc by cv2
    x = np.arange(256)
    y = (x / 255) ** (1 / g) * 255
    gamma_image_cv2 = cv2.LUT(img_g, y)
    axes2[ax+1].hist(gamma_image_cv2.ravel(), 256, [0,256], label= "cv2")
    axes2[ax+1].set_title(f"gamma: {g}")
    axes2[ax+1].legend()

plt.show()

# calc tone curve
for g in gamma:
    value = np.zeros(256)
    for i in range(len(value)):
        value[i] = gamma_correction(i, g)
    plt.plot(value, label = f"gamma: {g}")

plt.title("tone_curve")
plt.legend()
plt.ylabel("corrected_value")
plt.xlabel("original_value")
plt.show()

numpy によるスクラッチで、OpenCV の出力と同じ出力結果が得られました。
コントラスト強調/低減
計算方法
コントラスト低減は以下の式で表されます。この時、入力の画素値を $I_{src}$ 、出力の画素値を $I_{dst}$ とします。また、二つのパラメーター $MIN$ 、 $MAX$ を使用します。
I_{dst} = MIN + \frac{I_{src}}{255}(MAX - MIN)
同様に、コントラスト強調は以下の式で表されます。
I_{dst} =
\begin{cases}
0 \quad (I_{src} < MIN)\\
255 \frac{I_{src} - MIN}{MAX - MIN} \quad (MIN < I_{src} < MAX)\\
255 \quad (MAX < I_{src})
\end{cases}

トーンカーブを確認すると、コントラスト低減では $MIN$ から $MAX$ の間に元画像の画素値が収まるように変換します。一方、コントラスト強調では$MIN$、$MAX$ をスレショルドに元画像の画素値をそれぞれ $0$、$255$ に変換し、 $MIN$ から $MAX$ の間を線形でつないでいることがわかります


実装
# enhance/reduce contrast
def contrast_enhancement(image_value, min, max):
    if image_value < min:
        enhanced_value = 0
    elif min <= image_value  <= max:
        enhanced_value = 255 * (image_value - min)/(max - min)
    else:
        enhanced_value = 255
    return enhanced_value

def contrast_reduction(image_value, min, max):
    reduced_value = min + image_value/255 * (max-min)
    return reduced_value

# parameter
min = 100
max = 230

image_enhanced = np.zeros(img_g.size).reshape(img_g.shape)
image_reduced = np.zeros(img_g.size).reshape(img_g.shape)
for i in range(img_g.shape[0]):
    for j in range(img_g.shape[1]):
        image_enhanced[i,j] = contrast_enhancement(img_g[i,j], min, max)
        image_reduced[i,j]  = contrast_reduction(img_g[i,j], min, max)

# calc by cv2
lut_enhanced = np.zeros(256)
for i in range(0, min):
    lut_enhanced[i] = 0
for i in range(min, max):
    lut_enhanced[i] = 255 * (i - min) / (max - min)
for i in range(max, 255):
    lut_enhanced[i] = 255

image_enhanced_cv2 = cv2.LUT(img_g, lut_enhanced)

lut_reduced = np.zeros(256)
for i in range(0,255):
    lut_reduced[i] = min + i * (max - min) / 255
image_reduced_cv2 = cv2.LUT(img_g, lut_reduced)

fig, axes = plt.subplots(1,3, tight_layout=True)
axes[0].imshow(img_g, cmap = "gray")
axes[0].set_title("original")

axes[1].imshow(image_enhanced, cmap = "gray")
axes[1].set_title("enhanced")

axes[2].imshow(image_reduced, cmap = "gray")
axes[2].set_title("reduced")

fig2, axes2 = plt.subplots(1,3, tight_layout=True)
axes2[0].hist(img_g.ravel(), 256, [0,256])
axes2[0].set_title("original")

axes2[1].hist(image_enhanced.ravel(), 256, [0,256], label = "numpy")
axes2[1].hist(image_enhanced_cv2.ravel(), 256, [0,256], label = "cv2")
axes2[1].set_title("enhanced")
axes2[1].legend()

axes2[2].hist(image_reduced.ravel(), 256, [0,256], label = "numpy")
axes2[2].hist(image_reduced_cv2.ravel(), 256, [0,256], label = "cv2")
axes2[2].set_title("reduced")
axes2[2].legend()

plt.show()

# calc tone curve
value_reduced = np.zeros(256)
value_enhanced = np.zeros(256)
for i in range(len(value)):
    value_reduced[i] = contrast_reduction(i, min, max)
    value_enhanced[i] = contrast_enhancement(i, min, max)
plt.plot(value_reduced, label = "contrast_reduction")
plt.plot(value_enhanced, label= "contrast_enhancement")
plt.title(f"contrast enhancement/reduction, min:{min}, max:{max}")
plt.legend()
plt.show()

numpy によるスクラッチで、OpenCV の出力と同じ出力結果が得られました。
おわりに
ガンマ補正、コントラスト強調/低減を理解するために、自身の学びを出力しました。違っている点など見つかれば適宜修正します。ご指摘いただけると感謝です。