はじめに
カメラを用いて、画像の変位分布を測定する手法の一つに、サンプリングモアレ法があります。縞模様を張り付けた対象が歪んだ際の画像に対し、元の縞模様を重ねるとモアレ縞が発生します。この縞を解析することで、対象のどの部位が大きく歪んだのかを可視化することができます。
サンプリングモアレ法では元の縞画像の代わりに、カメラの画素を使用します。すなわち、Nつ分の画素で一つの縞になるように設定し、変位した縞画像を間引きます。間引いた間を線形補完することでモアレ縞を生成します。
参考文献に洗練されたソースコードがあったため、本記事では実務寄りの可視化方法を試してみました。先人は偉大です。
参考文献
一次元に対する変位
画像生成
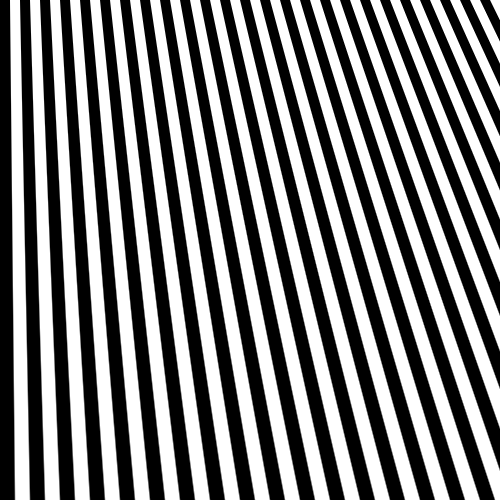
テスト画像を生成します。縦縞画像を生成した後、射影変換により直角台形へ画像サイズを変形させます。その後、元の画像サイズで出力させます。コードはChatGPT先生に頑張ってもらいました。
import cv2
import numpy as np
import matplotlib.pyplot as plt

# 画像サイズ設定
width, height = 500, 500

# 画像生成
image = np.zeros((height, width, 3), dtype=np.uint8)
image.fill(255)  # Set the image to white

# 縞の色とサイズを設定
colors = [(0, 0, 0), (255, 255, 255)]
stripe_width = width // 50

# 縞を生成
for i in range(50):
    cv2.rectangle(
        image,
        (i * stripe_width, 0),
        ((i + 1) * stripe_width - 1, height - 1),
        colors[i % len(colors)],
        -1,
    )

# 画像を射影変換
src_points = np.float32([[0, 0], [width - 1, 0], [width - 1, height - 1], [0, height - 1]])
dst_points = np.float32(
    [
        [0, 0],
        [width - 1, 0],
        [width - 1 + 0.3 * height, height - 1],
        [0, height - 1],
    ]
)

transformation_matrix = cv2.getPerspectiveTransform(src_points, dst_points)
transformed_image = cv2.warpPerspective(image, transformation_matrix, (width, height))

# 変形画像を表示
plt.imshow(cv2.cvtColor(transformed_image, cv2.COLOR_BGR2RGB))
plt.show()

# 変形画像を保存
cv2.imwrite("skewed_stripe_image.png", transformed_image)
設定した変位の可視化
上述のコードで得た射影変換行列を用いて、座標の変位を可視化します。
変数displacementにそれぞれx,y 軸方向の変位を格納します。
射影変換に関してはnkmkさんの記事がわかりやすかったです。
displacement = np.zeros((height, width,2), dtype=np.float32)
for y in range(height):
    for x in range(width):
        original_coord = np.array([[x, y]], dtype=np.float32)
        transformed_coord = cv2.perspectiveTransform(np.array([original_coord]), transformation_matrix)

        displacement[y, x] = original_coord-transformed_coord #- original_coord

dis_x, dis_y = np.split(displacement,2, axis =2)
plt.imshow(dis_x, cmap = "GnBu")
plt.title("displacement_x_axis")
plt.colorbar()
plt.savefig("displacement_x_axis.png")
サンプリングモアレ法
先人のコードです。
import numpy as np
from scipy import signal
from scipy import interpolate

def drop_interp1D(array,n,start):
    """
    n点に1点サンプリングし、もとの配列と同じになるように間を線形補間する
    """
    x = np.linspace(0.0,1.0,array.shape[0])
    f = interpolate.interp1d(x[start::n],array[start::n].flatten(),kind="linear",bounds_error=False,fill_value=0.0)
    return f(x)

def sampling_moire(array,n):
    """
    モアレ画像の位相マップを作成する
    """
    sin_sum = np.zeros_like(array,dtype=np.float64)
    cos_sum = np.zeros_like(array,dtype=np.float64)
    for i in range(n):
        ds = drop_interp1D(array,n,i)
        sin_sum += ds * np.sin(2.0*np.pi/n*i)
        cos_sum += ds * np.cos(2.0*np.pi/n*i)
    return np.arctan2(-sin_sum,cos_sum)

def sampling_moire_fft(array,n):
    #上の関数のFFT使ったバージョン
    ds = []
    for i in range(n):
        ds.append(drop_interp1D(array,n,i))
    fft = np.fft.fft(ds,axis=0)[1] #一番低い周波数成分(直流除く)
    return np.angle(fft)
画像への適応
サンプリングによるモアレ縞の生成
import cv2
import numpy as np

# 画像読み込み、グレースケール化
img_gray = cv2.imread('skewed_stripe_image.png' cv2.IMREAD_GRAYSCALE)
plt.imshow(img_gray, cmap = "Greys")
plt.colorbar()
#ヒストグラムをファイル出力
plt.hist(img_gray.ravel(),256,[0,256]);

#明るさの平均値と標準偏差を画面表示
print("mean: " + str(np.mean(img_gray)))
print("std : " + str(np.std(img_gray)))
import numpy as np
from scipy import interpolate
#参考:https://qiita.com/shiba54/items/0511d3ba978909590b3d

#縞の幅
n = 20
#測定対象
obj = img_gray

#サンプリングしたモアレ縞を生成
for i in range(n):
    x = np.linspace(0.0, 1.0, obj.shape[0])
    interp_image = []
    for j in range(obj.shape[1]):
        vs = obj[j, :]
        f = interpolate.interp1d(x[i::n], vs[i::n], kind="linear", bounds_error=False, fill_value=0.0)
        interpolated_values = f(x)
        interp_image = np.concatenate([interp_image, interpolated_values],0)
    interp_image = interp_image.reshape(obj.shape)
    plt.imshow(interp_image, cmap = "Greys")
    plt.colorbar()
    plt.show()
変位の可視化
def draw_moire_image_x_direction(obj, n):
    #位相接続した画像を格納するリスト
    h_unwraped_im_moire_deformation  = []
    #位相接続しない画像を格納するリスト
    h_im_moire_deformation  = []
    for i in range(len(obj[:,0])):
        im_dim_1_moire = sampling_moire_fft(obj[i,:],n)
        unwraped_im_dim_1_moire =np.unwrap(sampling_moire_fft(obj[i,:],n))
        h_im_moire_deformation.append(im_dim_1_moire)
        h_unwraped_im_moire_deformation.append(unwraped_im_dim_1_moire)
    fig = plt.figure()
    plt.imshow(h_unwraped_im_moire_deformation,cmap="GnBu")
    plt.colorbar()
    plt.show()

    plt.imshow(h_im_moire_deformation,cmap="GnBu")
    plt.colorbar()
    plt.show()


#縞の幅
n = 20
#測定対象
obj = img_gray
draw_moire_image_x_direction(obj,n)
変位の程度や正確な変位分布にずれはありますが、右下方向への歪みを検出できていそうです。
[サンプリングモアレ法により検出した変位分布]
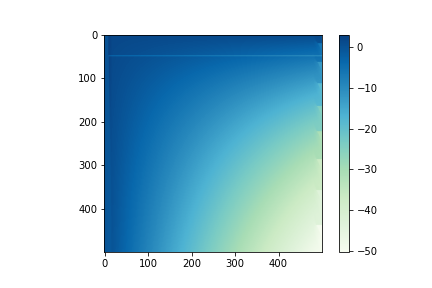
[参考:設定した変位分布]

二次元に対する変位
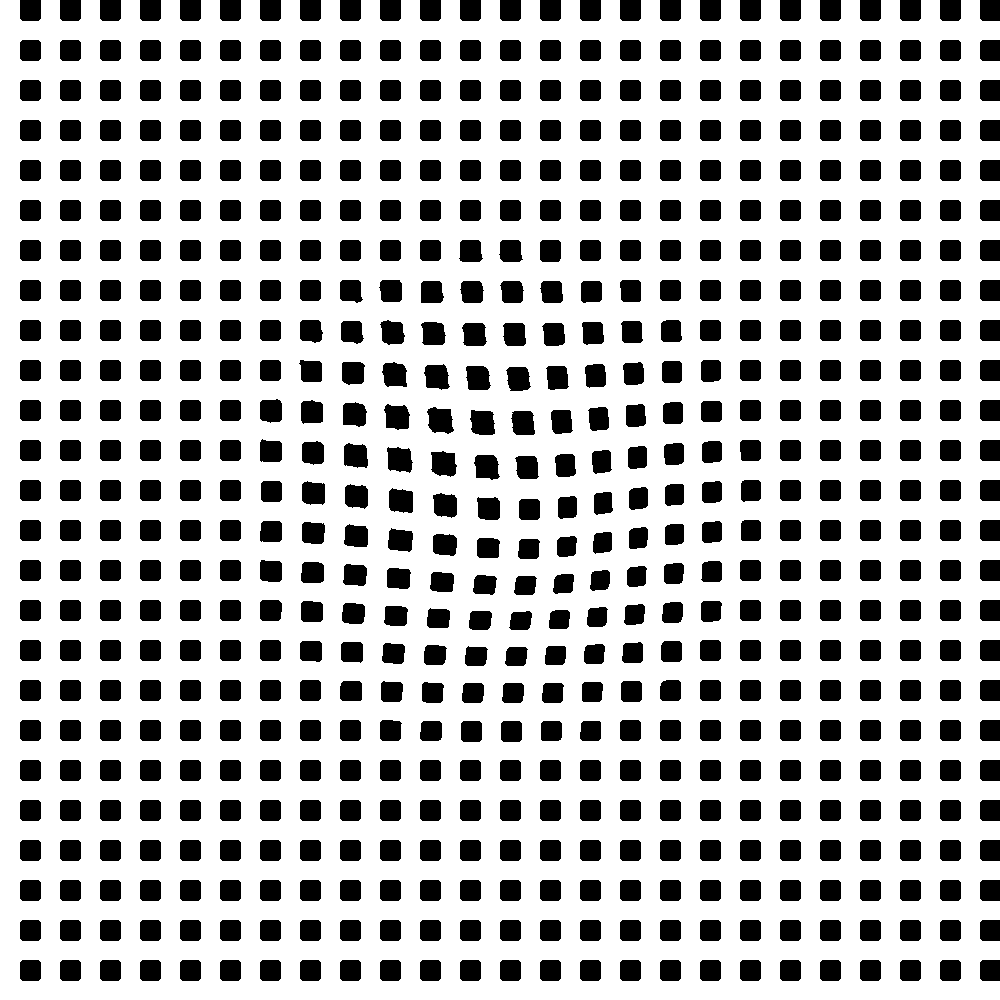
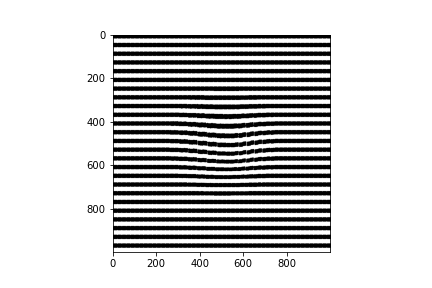
二次元に対しては、x,y 軸方向それぞれの変位分布を取ります。実用的に、縦横に白いラインが入った画像から、画像処理により両方向への縞を生成させます。今回は対象画像を縞模様の半分だけx,y 軸方向にスライドし、重ねることで、疑似的に再現しました。
画像生成
テスト画像を生成します。またまたChatGPT先生に頑張ってもらいました。
ベース画像サンプルコード
import cv2
import numpy as np

# 画像設定
width, height = 1000, 1000
dot_size = 20
dot_interval = 20
shift_right = 20

# 画像生成
image = np.full((height, width, 3), 255, dtype=np.uint8)

#ドットの描写
for i in range(shift_right, width, dot_size + dot_interval):
    for j in range(0, height, dot_size + dot_interval):
        image[j:j + dot_size, i:i + dot_size] = (0, 0, 0)
# 画像の保存
cv2.imwrite("shifted_square_dot_pattern.png", image)
x軸方向変位サンプルコード
import cv2
import numpy as np

image = cv2.imread("shifted_square_dot_pattern.png", cv2.IMREAD_GRAYSCALE)
rows, cols = image.shape

# マッピングと変位設定
def gaussian_skew_mapping(x, y, amplitude, sigma):
    return amplitude * np.exp(-((y - rows // 2) ** 2) / (2 * sigma ** 2))


transformation_matrix = np.float32([[1, 0, 0], [0, 1, 0]])
skewed_image = np.zeros_like(image)

for y in range(rows):
    for x in range(cols):
        deformation = int(gaussian_skew_mapping(x, y, 20, 100))
        new_x = x + deformation
        if 0 <= new_x < cols:
            skewed_image[y, new_x] = image[y, x]

# 画像の保存
cv2.imwrite("x_direction_skewed_image.png", skewed_image)
xy軸方向変位サンプルコード
import cv2
import numpy as np

# 画像読み込み
image = cv2.imread("shifted_square_dot_pattern.png", cv2.IMREAD_GRAYSCALE)
rows, cols = image.shape

# マッピング、変位設定
def gaussian_skew_mapping(x, y, amplitude, sigma):
    return amplitude * np.exp(-((x - cols // 2) ** 2 + (y - rows // 2) ** 2) / (2 * sigma ** 2))

transformation_matrix = np.float32([[1, 0, 0], [0, 1, 0]])
skewed_image = np.zeros_like(image)

for y in range(rows):
    for x in range(cols):
        deformation_x = int(gaussian_skew_mapping(x, y, 20, 100))
        deformation_y = int(gaussian_skew_mapping(x, y, 20, 100))
        new_x = x + deformation_x
        new_y = y + deformation_y
        if 0 <= new_x < cols and 0 <= new_y < rows:
            skewed_image[new_y, new_x] = image[y, x]


# メディアンフィルター
kernel_size = 5
filtered_image = cv2.medianBlur(skewed_image, kernel_size)

# 画像保存
cv2.imwrite("xy_direction_skewed_image.png", filtered_image)
画像前処理
x軸方向
import cv2
import matplotlib.pyplot as plt

#画像読み込み、反転
#img_x = cv2.imread("x_direction_skewed_image.png" ,cv2.IMREAD_GRAYSCALE)
img_xy = cv2.imread("xy_direction_skewed_image.png" ,cv2.IMREAD_GRAYSCALE)
inv_img_xy = cv2.bitwise_not(img_xy)

#ドットのサイズ
dot_pixel_size =20

# 画像を垂直方向に波長の半分だけずらす
rows, cols, = inv_img_xy
v_shifted_image = np.zeros_like(inv_img_xy)
v_shifted_image[dot_pixel_size:, :] = inv_img_xy[:-dot_pixel_size, :]
v_shifted_image[:dot_pixel_size,:]= inv_img_xy[dot_pixel_size:2*dot_pixel_size,:]

#画像の結合
merged_image_x = inv_img_xy+v_shifted_image
plt.imshow(merged_image_x, cmap = "Greys")
plt.savefig("vertical stacked image")
変位の可視化
draw_moire_image_x_direction(merged_image_x,40)
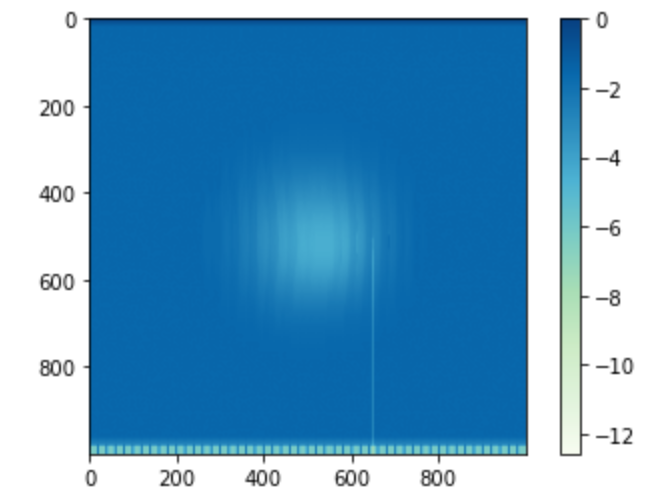
中心部位の変位が抜き出せていますが、バックグラウンドの修正が必要みたいです。
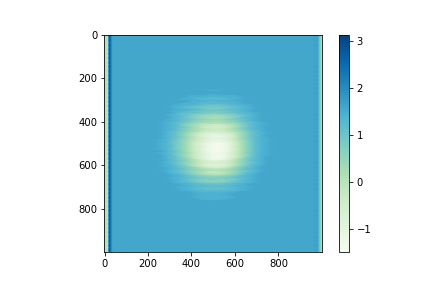
y軸方向
import cv2
import matplotlib.pyplot as plt

#画像読み込み、反転
#img_x = cv2.imread("x_direction_skewed_image.png" ,cv2.IMREAD_GRAYSCALE)
img_xy = cv2.imread("xy_direction_skewed_image.png" ,cv2.IMREAD_GRAYSCALE)
inv_img_xy = cv2.bitwise_not(img_xy)

#ドットのサイズ
dot_pixel_size =20

rows, cols, = inv_img_xy.shape
h_shifted_image = np.zeros_like(inv_img_xy)
h_shifted_image[:, dot_pixel_size:] = inv_img_xy[:, :-dot_pixel_size]
h_shifted_image[:,:dot_pixel_size]= inv_img_xy[:,dot_pixel_size:2*dot_pixel_size]

#画像の結合
merged_image_y = inv_img_xy+h_shifted_image
plt.imshow(merged_image_y, cmap = "Greys")
plt.savefig("horizonal stacked image")
変位の可視化
def draw_moire_image_y_direction(obj,n):
    #vertical moire detection
    v_unwraped_im_moire_deformation  = []
    v_im_moire_deformation  = []
    for i in range(len(obj[:,0])):
        im_dim_1_moire = sampling_moire_fft(obj[:,i],n)
        unwraped_im_dim_1_moire =np.unwrap(sampling_moire_fft(obj[:,i],n))
        v_im_moire_deformation.append(im_dim_1_moire)
        v_unwraped_im_moire_deformation.append(unwraped_im_dim_1_moire)
    #画像方向の修正
    v_unwraped_im_moire_deformation =np.fliplr(np.rot90(v_unwraped_im_moire_deformation,3))
    plt.imshow(v_unwraped_im_moire_deformation,cmap="GnBu")
    plt.colorbar()
    plt.show()

    plt.imshow(v_im_moire_deformation,cmap="GnBu")
    plt.colorbar()
    plt.show()


draw_moire_image_y_direction(merged_image_y,40)
最後に
サンプリングモアレ法による変位計測方法を追加しました。
先人の偉大なコードのおかけで、本記事は成り立っています。独学マンにとって、技術記事を書いてくださる人には感謝しかありません。

