NetworkX
NetworkXはネットワーク構造を扱うためのPythonパッケージです。
グラフオブジェクトの作成
グラフ(ノードとエッジの集合)をGraphオブジェクトで定義できます。
import networkx as nx
G = nx.Graph()
Graph Generatorをつかうことで、各種グラフを作ることができます。(Jupyter Notebookを使うと表示が簡単です)
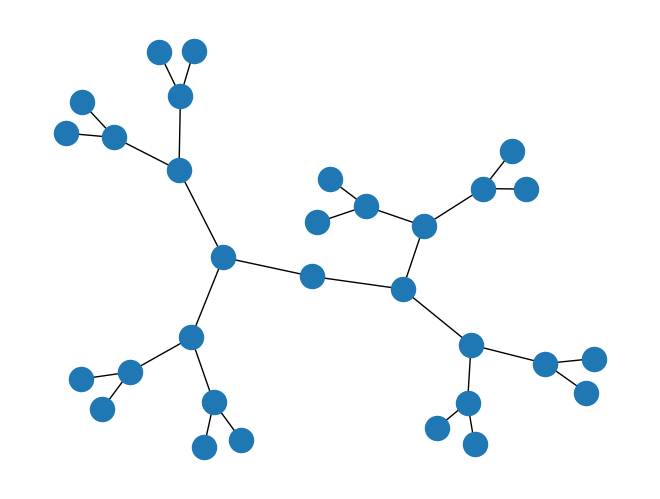
G = nx.balanced_tree(2, 4)
nx.draw(G)

ノードの追加
グラフGにノードをつけることができます。
# A. 数値1のノードを追加
G.add_node(1)
# B. 数値2, 3のノードを追加
G.add_nodes_from([2, 3])
# C. タプル(4, {"color": "red"}), (5, {"color": "green"})のノードを追加
G.add_nodes_from([(4, {"color": "red"}), (5, {"color": "green"})])
エッジの追加
ノード間にエッジを追加することができます。
G.add_edge(1, 2) # ノード間にエッジを追加
e = (2, 3)
G.add_edge(*e) # タプルで表されたノード間にエッジを追加

ノード、エッジの削除
グラフのノードまたはエッジを削除できます。
G.add_nodes_from([1, 2, 3, "a"])
G.remove_node(2)
list(G.nodes)  # [1, 3, 'a']
remove_node(n), remove_nodes_from([n,...]), remove_edge(n), remove_edges_from([n,...])などがあります。
グラフ構造を表現
グラフ表現のために決められたフォーマットから、グラフを作成できます。エッジリストや隣接ノードのディクショナリなどが使えます。
- エッジリスト
edgelist = [(0, 1), (1, 2), (2, 3)]
H = nx.Graph(edgelist)  # create a graph from an edge list
list(H.edges()) # [(0, 1), (1, 2), (2, 3)]
- 隣接ノードのディクショナリ
adjacency_dict = {0: (1, 2), 1: (0, 2), 2: (0, 1)}
H = nx.Graph(adjacency_dict)  # create a Graph dict mapping nodes to nbrs
list(H.edges()) # [(0, 1), (0, 2), (1, 2)]
エッジの重みを表現
エッジに重みをつけるにはadd_weight_edges_from([...])を使うことができます
FG = nx.Graph()
FG.add_weighted_edges_from([(1, 2, 0.125), (1, 3, 0.75), (2, 4, 1.2), (3, 4, 0.375)])
for n, nbrs in FG.adj.items():
   for nbr, eattr in nbrs.items():
       wt = eattr['weight']
       if wt < 0.5: print(f"({n}, {nbr}, {wt:.3})"

# (1, 2, 0.125)
# (2, 1, 0.125)
# (3, 4, 0.375)
# (4, 3, 0.375)
グラフの描画
グラフを描画するにはMatplotlibを使うことができます。
import networkx as nx
import matplotlib.pyplot as plt

G = nx.petersen_graph()
subax1 = plt.subplot(121)
nx.draw(G, with_labels=True, font_weight='bold')
subax2 = plt.subplot(122)
nx.draw_shell(G, nlist=[range(5, 10), range(5)], with_labels=True, font_weight='bold')

Jupyter Notebookであればnx.draw(G,...)だけで一つのグラフを描画できます。
