はじめに
Google Cloud PlatformのVirtual MachineでPython使ってOpenWeatherMapのAPIたたいて、天気情報をThingSpeakにあげてたけど、ThingSpeakのMATLAB Visualizationsで直接OpenWeatherMapのAPI叩いたらいいんじゃないかと思って試してみた。
試してみると、MATLAB Visualizationsだけじゃ、データを蓄積する機能がないので、微妙だということがわかった。
前提
ThingSpeakの登録とか、こんなことした。
pythonを使ってOpenWeatherMapから天気情報を取得 - Qiita
ThingSpeakでMATLAB Visualization使ってグラフをカスタマイズ - Qiita
Nature Remoで測定した室温をThingSpeakに渡して表示。 - Qiita
MATLAB Code
こんな感じで書いてみた。xxxのところを自分のAPPIDに変更。Kobe以外の都市知りたい人はそこも変更。
webreadしたらjsonが構造体として読み込まれてそう。楽ちん。
グラフを早く表示したいので、pauseを0.1秒にしてる。イラチ。
i_max = 10;
temperature = zeros(1,i_max);
humidity = zeros(1,i_max);

for i=1:i_max
    url = 'http://api.openweathermap.org/data/2.5/weather?units=metric&q=Kobe&APPID=xxx';
    weather = webread(url);
    weather.main;
    temperature(i) = weather.main.temp;
    humidity(i) = weather.main.humidity;
    pause(0.1);
end

figure;
plot([1:i_max], temperature);
grid on;
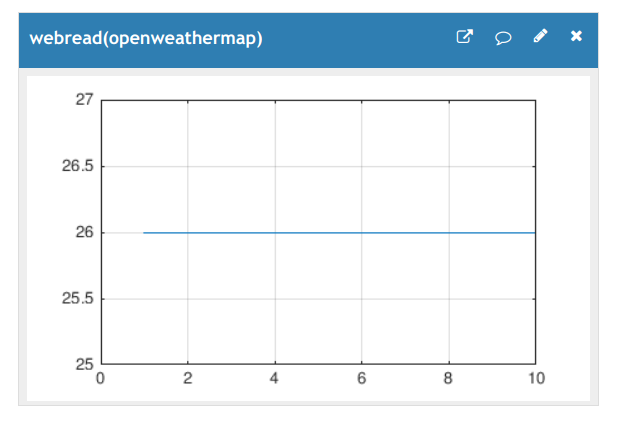
結果
どうも、Channelのサイトひらいたときに実行される。
データをそんとき読み込むので、そんときのデータしか表示できない。
おわりに
思ったことはできなかったけど、うまく使えば便利かも。
MATLABユーザーは試したらいいと思う。
MATLAB Analysisも使ってみよかな。