前回の続き。
前回セットアップした赤外線カメラで何かしようと思い、試しに自分の睡眠状態を監視/グラフ化させてみた。
睡眠状態を監視/グラフ化する
睡眠の監視/グラフ化として、とりあえず以下の2点を目標とした。
- カメラに自分が寝ている時の動作を検知させ、その変化量をデータベースに保存する
- データベースに蓄積された変化量をグラフ化することで、自分が寝ている時どれくらい動いているかを可視化する
これらを実現するため、以下モジュールを使用した。
- motion
カメラで動体検知した時の変化量/タイムスタンプを、MySQLのデータベースにINSERT実行させる - MySQL
motionで取得した変化量/タイムスタンプを蓄積する - lighttpd
MySQLで蓄積された変化量/タイムスタンプを、Webページでグラフ表示させる

MySQLの設定
- MySQLのインストール、初期設定(ルートユーザの設定)
sudo apt-get install mysql-server
mysql_secure_installation
- MySQLにログイン
mysql -u root -p
- 任意のデータベースを作成
CREATE MOTION_DB;
USE MOTION_DB;
- motionが使用する、変化量/タイムスタンプを保存する任意のテーブルを作成
CREATE TABLE sleep_check (camera int, event_time_stamp timestamp not null);
- morion/lighttpdがデータベースを参照するためのユーザアカウントを追加
CREATE USER ‘your_sql_name'@'localhost' IDENTIFIED BY 'your_sql_password';
GRANT ALL PRIVILEGES ON database_name.* TO 'your_sql_name'@'localhost';
motionの設定
motionからMySQLへデータ送信するため、/etc/motion/motion.confの一部を以下のように設定。
# MySQLへのログイン設定
database_type mysql
database_dbname motion_db #使用するデータベース名
database_host localhost
database_user your_sql_name # MySQLで作成したユーザアカウント名
database_password your_sql_password # MySQLで作成したユーザアカウントのパスワード
database_busy_timeout 10

# MySQLへ変化量/タイムスタンプ登録処理を行うINSERT命令
# sql_query insert into テーブル名 (MySQLのテーブル登録で定義したデータ群) values(motionからMySQLへ送るデータ)
sql_query insert into sleep_check(changed_pixels, time_stamp) values('%D', '%Y-%m-%d %T')
motionからSQLへ送信可能なデータの一覧はこちら。
今回は変化量(ピクセル値)とタイムスタンプのみ送信させる。
lighttpdの設定
グラフの描写、lighttpdにおけるWebページへの表示については、こちらのサイト"センサの記録をグラフ化 "を参考にさせて頂きました(というかほぼ丸パクリ)。
以下の順序でグラフ表示を行う。
- グラフ描写を行うhtmlファイルのテンプレートを用意
- データベースから変化量/タイムスタンプの一覧を取得し、1のテンプレートファイルにグラフデータとして書き込むPythonプログラムを用意
- lighttpdに2のPythonプログラムをCGIとして登録、Webページにグラフを表示させる
PythonからMySQLを操作、htmlテンプレートを描写するためのパッケージ
sudo apt-get install python-pip
sudo pip install MySQL-python
sudo pip install jinja2
データベースからグラフを描写するhtmlファイルの自動作成
グラフ描写のために、以下の2ファイルを用意する。
- Google Chart APIにより、変化量/タイムスタンプのグラフを描写するhtmlファイルのテンプレート
<html>
  <head>
    <title>Motion Check</title>
    <meta http-equiv="content-type" content="text/html; charset=utf-8" />
    <script type="text/javascript" src="https://www.google.com/jsapi"></script>
    <script type="text/javascript">
      google.load("visualization", "1", {packages:["corechart"]});
      google.setOnLoadCallback(drawChart);
      function drawChart() {
      var data = google.visualization.arrayToDataTable([
      ['Date', 'Pixel'],
      {% for record in pixel_list %}
      ['{{record.date}}',  {{record.pixel}}],
      {% endfor %}
      ]);
      // グラフのオプションを設定
      var options = {
      title: '{{title}}'
      };
      var chart = new google.visualization.LineChart(document.getElementById('chart_div'));
      chart.draw(data, options);
      }
    </script>
  </head>
  <body>

    <div id="chart_div" style="width: 80%; height: 400px;"></div>

  </body>
</html>
- データベースから変化量/タイムスタンプ値を取得、テンプレートに書き込むPythonプログラム
# !/usr/bin/python
# -*- coding: utf-8 -*-

from jinja2 import Environment, FileSystemLoader
import MySQLdb
import datetime

MAX_PIXEL = 30000

def pixel_chart(environ, start_response):
    env = Environment(loader=FileSystemLoader('./', encoding='utf8'))
    tpl = env.get_template('template.html')

    title = u"Pixel Chart"

    pixel_list = []

    connector = MySQLdb.connect(host="localhost", db="motion_db", user="your_sql_name", passwd="your_sql_passwd", charset="utf8")
    cursor = connector.cursor()
    sql = "select changed_pixels,time_stamp from sleep_check"

    cursor.execute(sql)
    records = cursor.fetchall()

    #テンプレートへ挿入するグラフデータの作成
    # 3000pixel以上は睡眠中ではなく、活動中の動きとして省く
    for record in records:
        if record[0] < MAX_PIXEL:
            pixel_list.append({'date':record[1].strftime("%H:%M:%S"), 'pixel':record[0]})
         else:
            pixel_list.append({'date':record[1].strftime("%H:%M:%S"), 'pixel':MAX_PIXEL})

    cursor.close()
    connector.close()

    #テンプレートへ挿入するデータの作成
    title = u"Pixel Chart"

    #テンプレートへの挿入
    html = tpl.render({'title':title, 'pixel_list':pixel_list})

    start_response('200 OK', [('Content-Type', 'text/html')])
    return [html.encode('utf-8')]

if __name__ == '__main__':
    from flup.server.fcgi import WSGIServer
WSGIServer(pixel_chart).run()
lighttpdの設定
- lighttpdのインストール
sudo apt-get install lighttpd
sudo apt-get --no-install-recommends install python-flup
- pythonプログラムをcgiとして登録しておく。
server.modules = (
    "mod_access",
    "mod_alias",
    "mod_compress",
    "mod_redirect",
    "mod_fastcgi",
)

server.document-root        = "/var/www"
server.upload-dirs          = ( "/var/cache/lighttpd/uploads" )
server.errorlog             = "/var/log/lighttpd/error.log"
server.pid-file             = "/var/run/lighttpd.pid"
server.username             = "www-data"
server.groupname            = "www-data"
server.port                 = 80

index-file.names            = ( "index.php", "index.html", "index.lighttpd.html" )
url.access-deny             = ( "~", ".inc" )
static-file.exclude-extensions = ( ".php", ".pl", ".fcgi" )

compress.cache-dir          = "/var/cache/lighttpd/compress/"
compress.filetype           = ( "application/javascript", "text/css", "text/html", "text/plain" )

# default listening port for IPv6 falls back to the IPv4 port
include_shell "/usr/share/lighttpd/use-ipv6.pl " + server.port
include_shell "/usr/share/lighttpd/create-mime.assign.pl"
include_shell "/usr/share/lighttpd/include-conf-enabled.pl"

fastcgi.server = (
    "get_pixel.py" => (
    "python-fcgi" => (
    "socket" => "/tmp/get_pixel.python.socket",
    "bin-path" => "/var/www/get_pixel.py",
    "check-local" => "disable",
    "max-procs" => 1
    		)
	    )
)
サービスの開始/利用
- サービス開始シェルスクリプト
測定の度にmotionが溜めた録画データとMySQLのDBを手動クリアするのが面倒だったため、サービス再起動スクリプトとして作成。
motion実行に"service motion start"を使った場合、/var/log/motion.logの作成に失敗して動作しなかったため、現時点は直接実行にしている。
# !/bin/sh

# Stop Daemons
service motion stop
service lighttpd stop

# Clear DB and record files
rm -f /var/lib/motion/*.jpg
mysql -u MySQLユーザ名 -pMySQLパスワード データベース名 -e "truncate table テーブル名;"

# Restart Daemons
motion -b
service lighttpd start
- Pythonプログラムの実行権限付加
グラフ描写は外部からPythonプログラムを叩いて行うため、chmod等により外部からの実行権限を与えておく。
chmod a+x /var/www/get_pixel.py
- グラフページへのアクセス
http://Raspberry PiのIPアドレス/get_pixel.pyにアクセスすることで、グラフが表示される。
動作結果
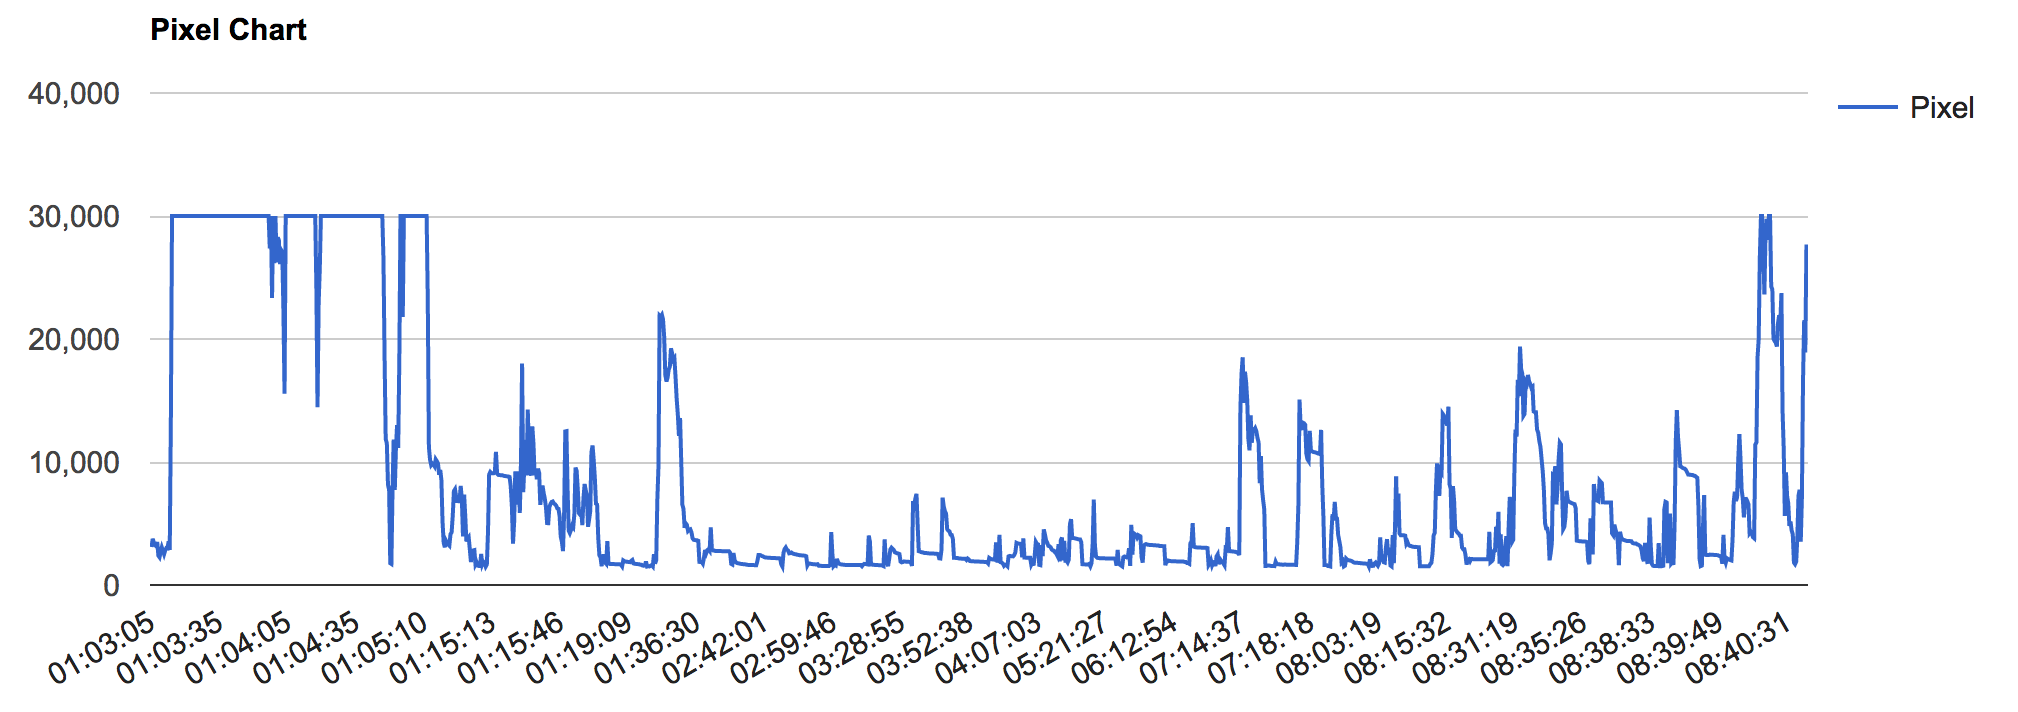
試しに一晩監視(1:04 - 8:39の間)させてみた結果、以下のグラフを得られた。
3000ピクセル以上の箇所は起き上がっている状態として省き、それ以下を眠っている状態として残した。

結果として、所々1000pixel越えの動きがあるため、安眠とは言い切れなさそう。
とはいえ、該当箇所でどんな動きをしているか分からないので、これだけでは改善の方針も立てられない。
次の目標として、あるpixel値以上の動きを検知したら録画するように、motionで設定 or motion自身に手を加えてみる予定。