前回の続き。
Factors
ファクターは資産からの関数。パイプラインでもっとも使用される用語であり、数値計算結果を表す。因数にはデータだけでなく日数の長さも入力する。
パイプラインのもっとも単純な要素は組み込み要素であり、あらかじめ一般的な計算を実行するために構築されている。最初の例では10日間の入力データの平均値を計算するSimpleMovingAverageを使用する。最初に組み込み要素のSimpleMovingAverageと価格データセットのUsequityPricingをインポートする。
from quantopian.pipeline.data.builtin import USEquityPricing
from quantopian.pipeline.factors import SimpleMovingAverage
Factorの作成
次に、make_pipeline関数を使ってSimpleMovingAverageファクタをインスタンス化する。inputsと呼ばれるBoundColumnオブジェクトにリストするオブジェクトと、移動平均計算で受け取るデータの日数を示すwindow_lengthの二つを引数として設定する。(BoundColumnについては後述。どのような種類のデータをファクタに渡すかを示すオブジェクト)
次の行は有価証券の10日間の終値の平均を計算するためのファクタを作成する。
 mean_close_10 = SimpleMovingAverage(
   inputs = [USEquityPricing.close]、
   window_length = 10
 )
実際には計算を実行しないことに注意する。ファクターを作成することは関数を定義することである。計算するにはパイプラインに追加する必要がある。
パイプラインにファクターを追加する
元の空のpipelineを更新して新しい移動平均ファクターを計算してみる。ファクターのインスタンスをmake_pipelineに移し、columnsに渡す。
def make_pipeline():

    mean_close_10 = SimpleMovingAverage(
    inputs=[USEquityPricing.close],
    window_length=10
  )

    return Pipeline(
        columns={
            '10_day_mean_close': mean_close_10
        }
    )
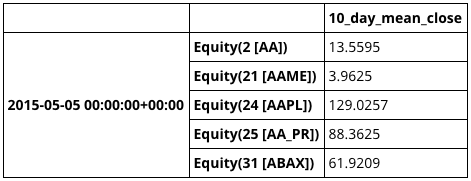
パイプラインを実行し、最初の数行を表示すると以下の通り。
result = run_pipeline(make_pipeline(), '2015-05-05', '2015-05-05')
result.head()
Pipeline.addメソッドを使って、既存のパイプラインインスタンスにファクターを追加することもできる。
>>> my_pipe = Pipeline()
>>> f1 = SomeFactor(...)
>>> my_pipe.add(f1)
Latest
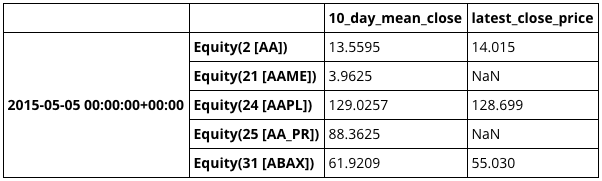
もっとも一般的に使用されている組み込みファクターはLatestであり、与えられたデータ列の最新の値を取得する。他の要素とは異なる形でインスタンス化されるほど一般的。最善の策は.latest属性を取得すること。make_pipelineをアップデートして終値をパイプラインに追加してみる。
def make_pipeline():

    mean_close_10 = SimpleMovingAverage(
        inputs=[USEquityPricing.close],
        window_length=10
    )
    latest_close = USEquityPricing.close.latest

    return Pipeline(
        columns={
            '10_day_mean_close': mean_close_10,
            'latest_close_price': latest_close
        }
    )
result = run_pipeline(make_pipeline(), '2015-05-05', '2015-05-05')
result.head()
デフォルトinputs
一部のファクターにはデフォルトでinputs設定されていて変更してはいけない。例えばVWAP組み込み係数(出来高加重平均)は常にUSEquityPricing.close``USEquityPricing.volumeから計算する。inputsを指定せずに呼び出すことができる。
from quantopian.pipeline.factors import VWAP
vwap = VWAP(window_length=10)
要素の結合
ファクターは組み込みの数学演算子を使って他のファクターとスカラー値の結合が容易に可能である。
>>> f1 = SomeFactor(...)
>>> f2 = SomeOtherFactor(...)
>>> average = (f1 + f2) / 2.0
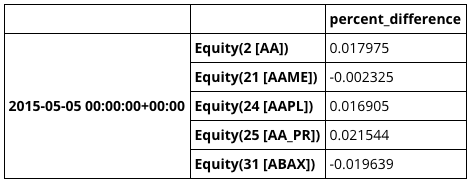
ここでは10日間の平均価格係数と30日間の平均価格係数を組み合わせてpercent_difference係数を計算するパイプラインを作る。
mean_close_10 = SimpleMovingAverage(
    inputs=[USEquityPricing.close],
    window_length=10
)
mean_close_30 = SimpleMovingAverage(
    inputs=[USEquityPricing.close],
    window_length=30
)
percent_difference = (mean_close_10 - mean_close_30) / mean_close_30
percent_differenceはファクターであり、パイプラインにコラムとして加えることができる。
def make_pipeline():

    mean_close_10 = SimpleMovingAverage(
        inputs=[USEquityPricing.close],
        window_length=10
    )
    mean_close_30 = SimpleMovingAverage(
        inputs=[USEquityPricing.close],
        window_length=30
    )

    percent_difference = (mean_close_10 - mean_close_30) / mean_close_30

    return Pipeline(
        columns={
            'percent_difference': percent_difference
        }
    )
result = run_pipeline(make_pipeline(), '2015-05-05', '2015-05-05')
result.head()
所感
これはもうMACDの原型を作ったようなものである。RSIなどは組み込み関数として用意されているし、Overviewを見てみると主要なテクニカル分析はサンプルコードが置いてあるので、テクニカル分析をバックテストするのも容易にできそうな印象を受ける。