前回の続き。
フィルター
フィルタはアセットと時間からブール値を返す。
パイプラインの最終出力を絞り込むために使われる。比較操作を使う方法ととFactor/Classifierメソッドを使う方法の2種類がある。
比較操作
FactorsとClassifiersを比較することでFiltersを作る。Classifiersはまだ見ていないので、Factorsのみ使う例をとりあげる。次の例は最新の終値が20
ドルを超えるとTrueを返すフィルタを作る。
last_close_price = USEquityPricing.close.latest
close_price_filter = last_close_price > 20
次の例は10日間の平均が30日間の平均を下回るたびにTrueを返すフィルタを作る。
mean_close_10 = SimpleMovingAverage(
    inputs=[USEquityPricing.close],
    window_length=10
)
mean_close_30 = SimpleMovingAverage(
    inputs=[USEquityPricing.close],
    window_length=30
)
mean_crossover_filter = mean_close_10 < mean_close_30
フィルターは毎日True/Falseを返す。
Factor/Classifierメソッド
FactorやClassifierの様々なメソッドはFiltersを返す。ここでもFactorメソッドのみ用いた例を見る。
Factor.top(n)メソッドは、毎日特定要因の上位n個の証券に対してTrueを返すFilterを生成する。
次の例はすべての証券のうち最終価格が上位200位入った証券についてTrueを返すフィルターを作る。
last_close_price = USEquityPricing.close.latest
top_close_price_filter = last_close_price.top(200)
Filtersを返すFactorメソッド一覧はこちら。
Filtersを返すClassifierメソッド一覧はこちら。
(本家一覧に飛びます)
ドルボリュームフィルター
30日間の平均ドルボリュームが10,000,000ドルを超えている場合にTrueを返すフィルターを作成する。まずはじめにAverageDollarVolume計数を作成して30日間の平均ドルボリュームを計算する必要がある。
AverageDollarVolumeフィルターをインポートするにはSimpleMovingAverageをインポートするために使用した行に追加する。
from quantopian.pipeline.factors import AverageDollarVolume, SimpleMovingAverage
ファクターをインスタンス化する。
dollar_volume = AverageDollarVolume(window_length=30)
デフォルトではAverageDollarVolumeはUSEquityPricing.closeとUSEquityPricing.volumeをinputとして使用しているので指定しない。
係数が得られたのでブール式でフィルターを作成できる。次の例はdollar_volumeが10,000,000ドルを超える証券に対してTrueを返すフィルターを作成する。
high_dollar_volume = (dollar_volume > 10000000)
パイプラインに列を追加する。
def make_pipeline():
mean_close_10 = SimpleMovingAverage(
inputs=[USEquityPricing.close],
window_length=10
)
mean_close_30 = SimpleMovingAverage(
inputs=[USEquityPricing.close],
window_length=30
)
percent_difference = (mean_close_10 - mean_close_30) / mean_close_30
dollar_volume = AverageDollarVolume(window_length=30)
high_dollar_volume = (dollar_volume > 10000000)
return Pipeline(
columns={
'percent_difference': percent_difference,
'high_dollar_volume': high_dollar_volume
},
)
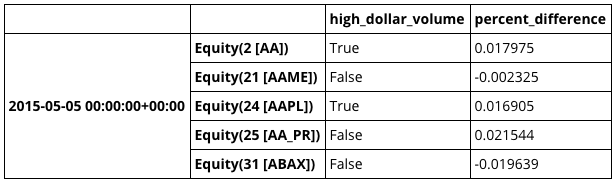
result = run_pipeline(make_pipeline(), '2015-05-05', '2015-05-05')
result.head()
パイプラインを作成して実行すると、各証券の結果に対応するブール値を持つ列high_dollar_volumeが作成される。
スクリーンの適用
デフォルトでは、パイプラインはQuantopianデータベース内のすべてのアセットに対して毎日計算値を生成するが、大抵我々が気にするのは特定の基準を満たすものの証券のみである。フィルターがFalseのものを無視するようにパイプラインに指示するには、screenキーワードを使用する。
30日平均ドルの金額が10,000,000ドルを超える有価証券のパイプライン出力をスクリーニングするには、high_dollar_volumeフィルターをscreen引数に渡す。make_pipelineは以下のようになる。
これを実行するとhigh_dollar_volumeを渡した証券のみ出力が生成される。
def make_pipeline():

  mean_close_10 = SimpleMovingAverage(
      inputs=[USEquityPricing.close],
      window_length=10
  )
  mean_close_30 = SimpleMovingAverage(
      inputs=[USEquityPricing.close],
      window_length=30
  )

  percent_difference = (mean_close_10 - mean_close_30) / mean_close_30

  dollar_volume = AverageDollarVolume(window_length=30)
  high_dollar_volume = (dollar_volume > 10000000)

  return Pipeline(
      columns={
          'percent_difference': percent_difference
      },
      screen=high_dollar_volume
  )
result = run_pipeline(make_pipeline(), '2015-05-05', '2015-05-05')
print 'Number of securities that passed the filter: %d' % len(result)
(訳注:len()はリストの要素数を取得。%dは%記法)

フィルターの反転
フィルターを反転するには~演算子をフィルターの前につける。
low_dollar_volume =~high_dollar_volume
フィルターの結合
フィルターを組み合わせるには&(and)または|(or)演算子を用いる。
以下の例では平均ドルボリュームの上位10%かつ最新の終値が20ドルを超える有価証券を選別する。まずAverageDollarVolumeとpercentile_betweenフィルターを作成する。
high_dollar_volume = dollar_volume.percentile_between(90, 100)
※percentile_betweenはFilterを返すFactorメソッド。
次にlatest_close係数を作成し、20ドル以上で終了した有価証券のフィルターを定義する。
latest_close = USEquityPricing.close.latest
above_20 = latest_close > 20
&を用いてhigh_dollar_volumeフィルターとabove_20フィルターを組み合わせることができる。
is_tradeable = high_dollar_volume&above_20
両方のフィルターがTrueのときのみTrueを返す。
このフィルターをパイプラインのスクリーンとして使用する場合、is_tradeableにscreenを設定する。
def make_pipeline():

    mean_close_10 = SimpleMovingAverage(
        inputs=[USEquityPricing.close],
        window_length=10
    )
    mean_close_30 = SimpleMovingAverage(
        inputs=[USEquityPricing.close],
        window_length=30
    )

    percent_difference = (mean_close_10 - mean_close_30) / mean_close_30

    dollar_volume = AverageDollarVolume(window_length=30)
    high_dollar_volume = dollar_volume.percentile_between(90, 100)

    latest_close = USEquityPricing.close.latest
    above_20 = latest_close > 20

    is_tradeable = high_dollar_volume & above_20

    return Pipeline(
        columns={
            'percent_difference': percent_difference
        },
        screen=is_tradeable
    )
result = run_pipeline(make_pipeline(), '2015-05-05', '2015-05-05')
print 'Number of securities that passed the filter: %d' % len(result)

所感
この内容とは直接関係ないが、公式ホームページのWorkshop欄を見てみると割と頻繁に、しかも世界各地でワークショップが開かれていて羨ましい。オンライン配信とかないのかな。とか思ったらWebinarってオンラインのセミナーらしいので一度登録してみるか。(レベルがどれくらいかはわからんけど)