ProxmoxでBonding
ProxmoxでネットワークBondingをトライ。例によって、GNS3環境で実施。
環境
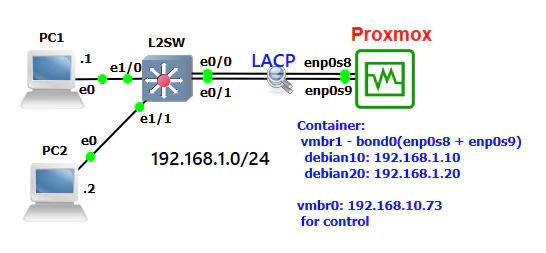
ホストであるProxmoxがL2Switch(L2SW)とLACPで接続されており、物理I/Fであるenp0s8とenp0s9とが仮想スイッチvmbr1としてBondingされている。ホスト上には2つのコンテナdebian10及びdebian20とが存在。L2SWには2台のPCが接続。すべての端末が、192.168.1.0/24のネットワークに所属している。
設定
L2SW
interface Port-channel1
 switchport

interface Ethernet0/0
 duplex auto
 channel-group 1 mode active

interface Ethernet0/1
 duplex auto
 channel-group 1 mode active
LACPの設定、特記事項なし。
Proxmox
ホスト
今回はGUIのみで設定。まずは、Bondingを作成。
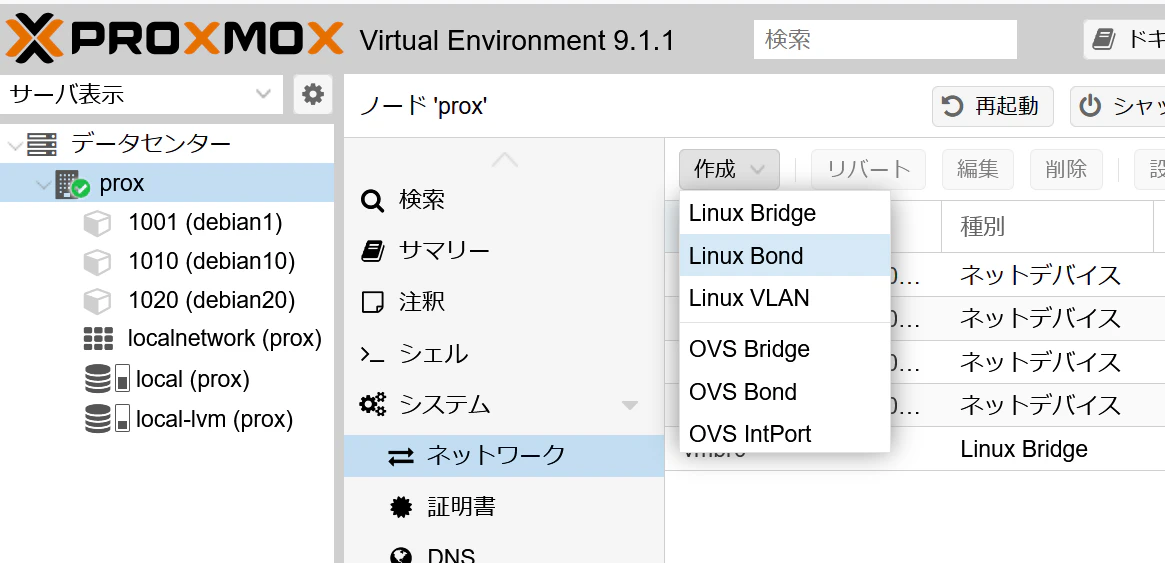
ネットワークにて、Linux Bondをクリック。
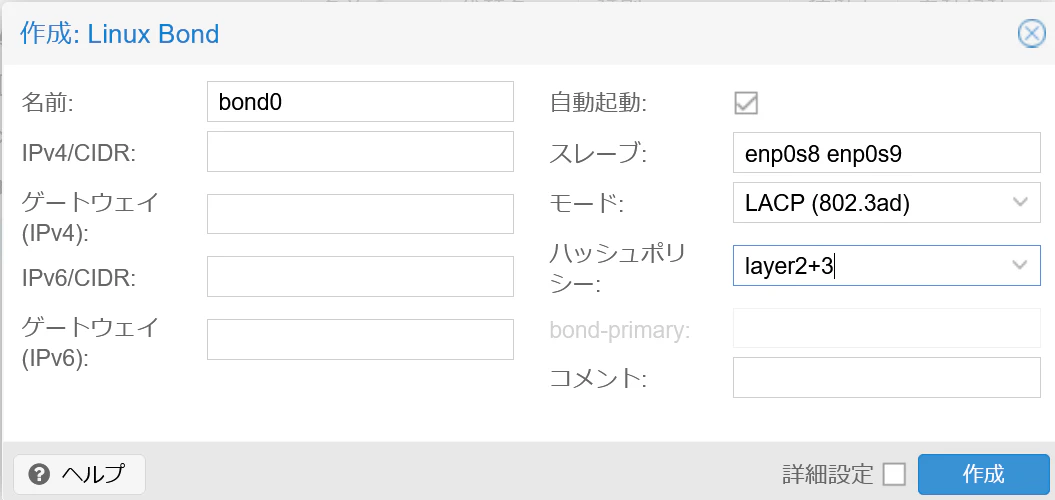
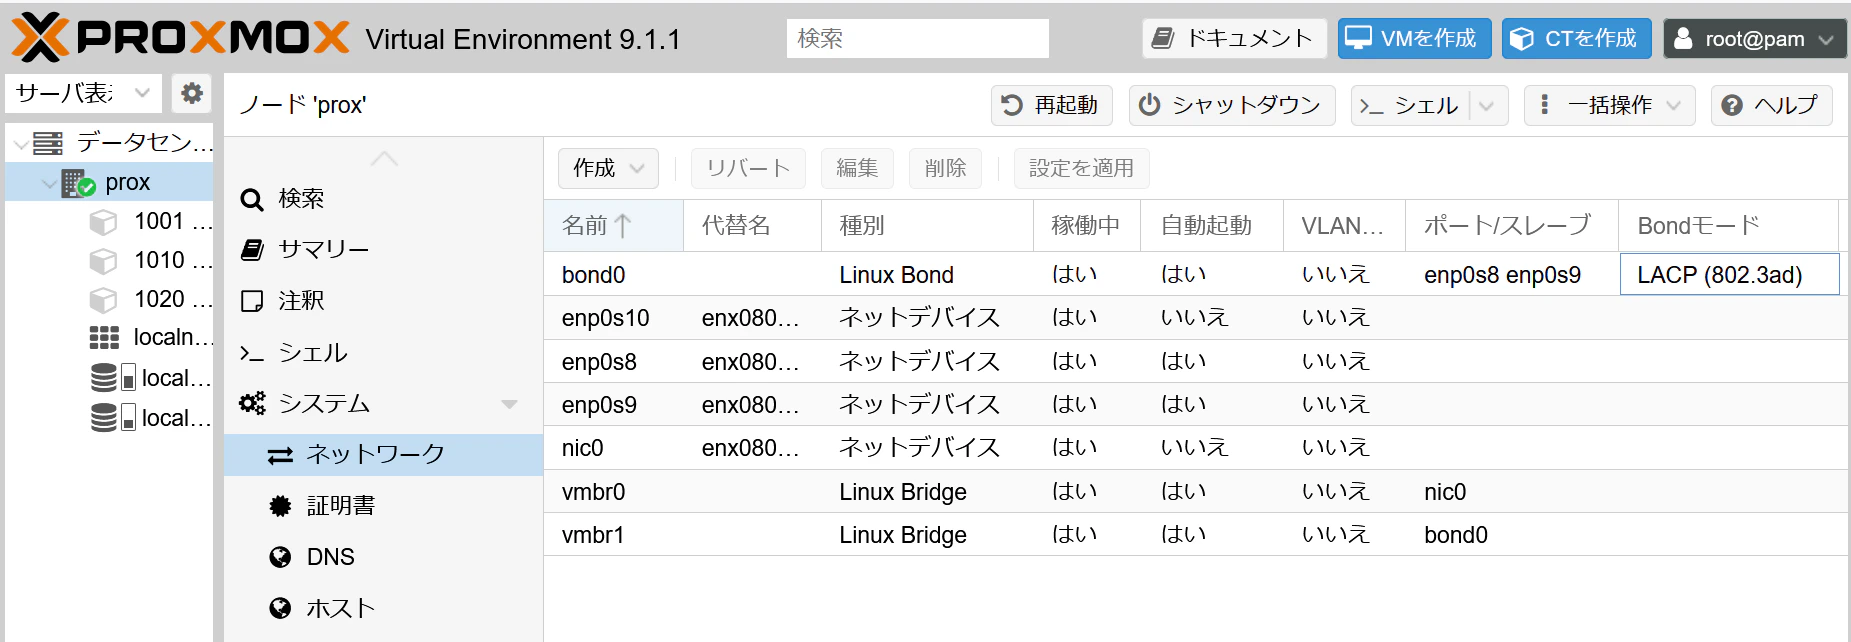
スレーブとして物理I/Fであるenp0s8およびenp0s9を選択、モードはLACP、ハッシュポリシーは適切に選択(ここでは、layer2+3)。
その後、設定を適用をクリック。次に、ネットワークスイッチ(Bridge)作成。
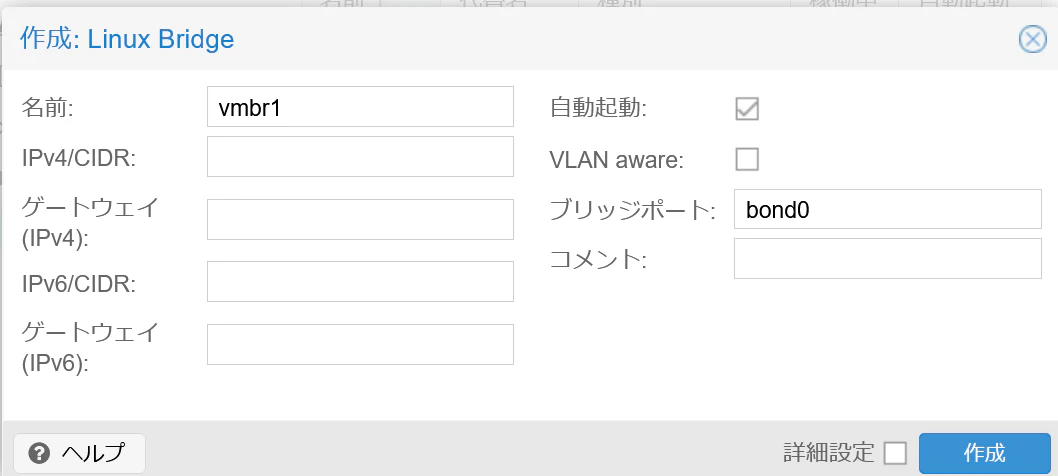
メンバーとして、先ほど作成したBonding(bond0)を指定。
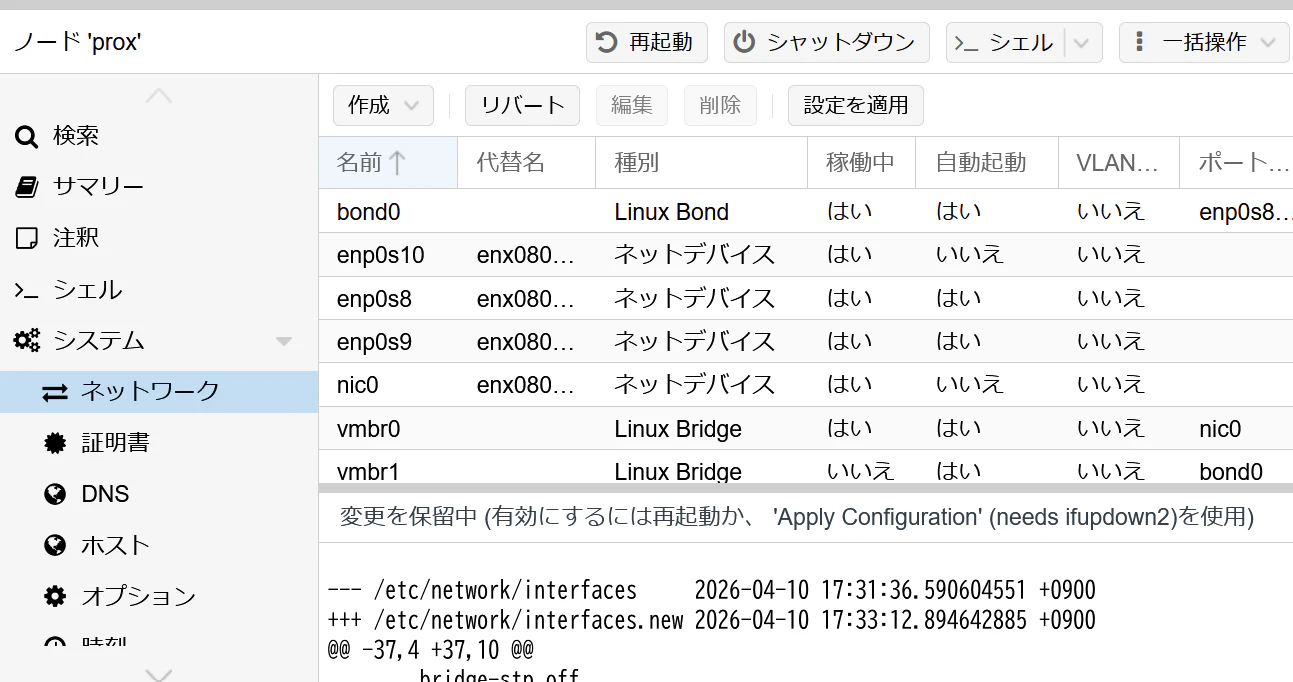
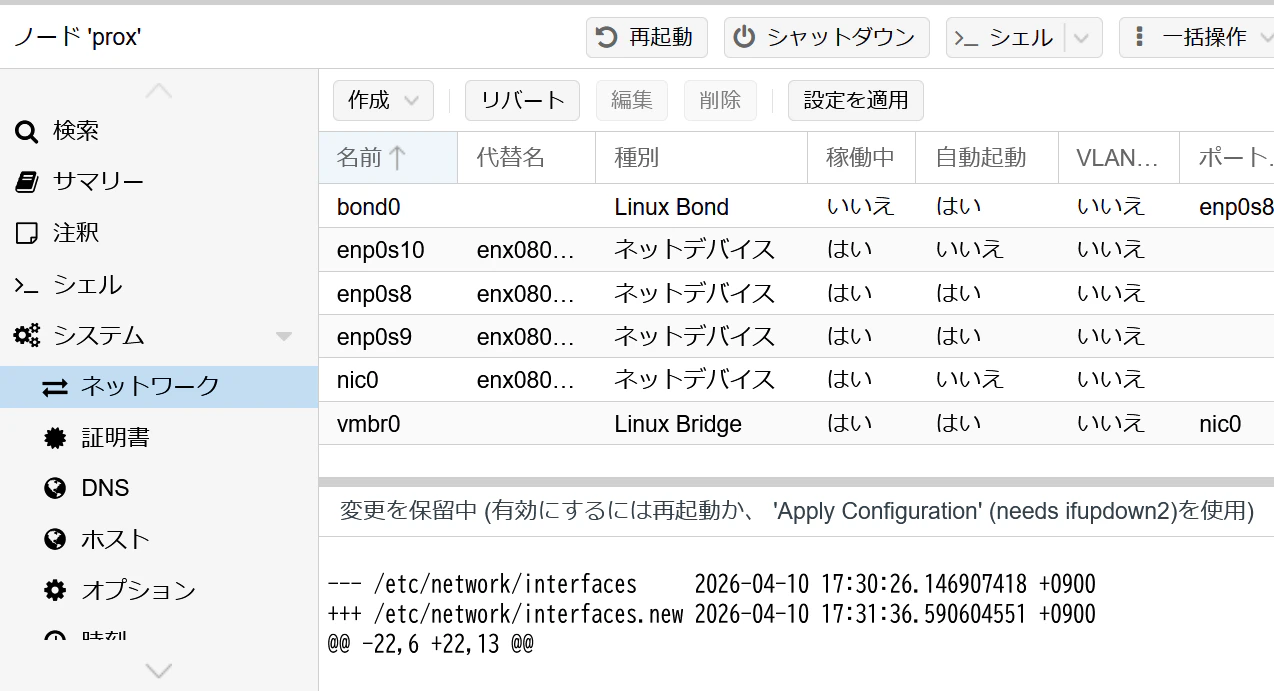
こちらも、設定を適用をクリック。最終的に作成されたネットワークI/Fは下記となる。
CLIでの設定ファイルは下記となっている。
auto lo
iface lo inet loopback

iface nic0 inet manual

auto enp0s8
iface enp0s8 inet manual

auto enp0s9
iface enp0s9 inet manual

iface enp0s10 inet manual

auto bond0
iface bond0 inet manual
        bond-slaves enp0s8 enp0s9
        bond-miimon 100
        bond-mode 802.3ad
        bond-xmit-hash-policy layer2+3

auto vmbr0
iface vmbr0 inet static
        address 192.168.10.73/24
        gateway 192.168.10.1
        bridge-ports nic0
        bridge-stp off
        bridge-fd 0

auto vmbr1
iface vmbr1 inet manual
        bridge-ports bond0
        bridge-stp off
        bridge-fd 0
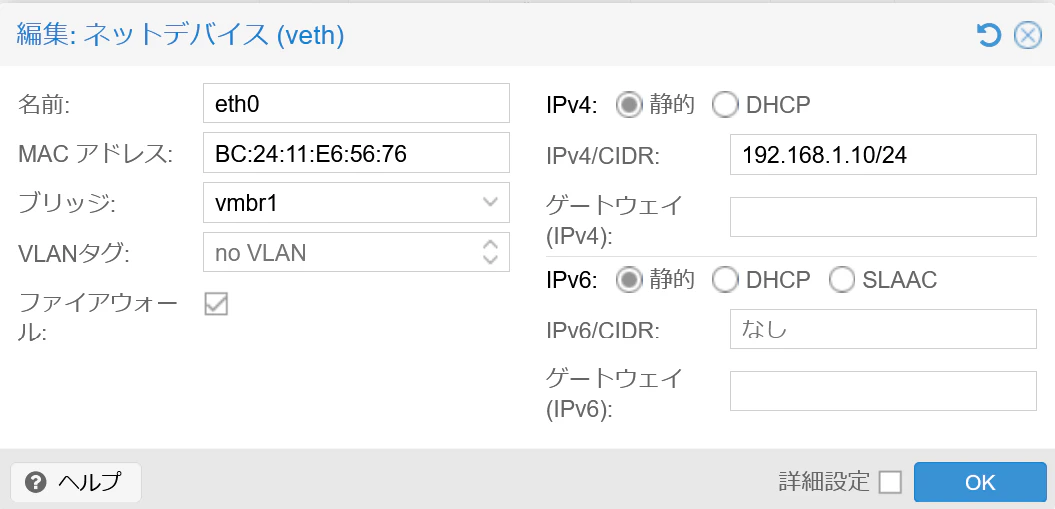
コンテナ
固定IPアドレス設定をするのみ。
検証
ホスト
Bonding状況
# cat /proc/net/bonding/bond0
Ethernet Channel Bonding Driver: v6.17.2-1-pve

Bonding Mode: IEEE 802.3ad Dynamic link aggregation
Transmit Hash Policy: layer2+3 (2)
MII Status: up
MII Polling Interval (ms): 100
Up Delay (ms): 0
Down Delay (ms): 0
Peer Notification Delay (ms): 0

802.3ad info
LACP active: on
LACP rate: slow
Min links: 0
Aggregator selection policy (ad_select): stable
System priority: 65535
System MAC address: 08:00:27:04:dd:bd
Active Aggregator Info:
        Aggregator ID: 1
        Number of ports: 2
        Actor Key: 9
        Partner Key: 1
        Partner Mac Address: aa:bb:cc:00:01:00

Slave Interface: enp0s8
MII Status: up
Speed: 1000 Mbps
Duplex: full
Link Failure Count: 0
Permanent HW addr: 08:00:27:04:dd:bd
Slave queue ID: 0
Aggregator ID: 1
Actor Churn State: none
Partner Churn State: none
Actor Churned Count: 0
Partner Churned Count: 0
details actor lacp pdu:
    system priority: 65535
    system mac address: 08:00:27:04:dd:bd
    port key: 9
    port priority: 255
    port number: 1
    port state: 61
details partner lacp pdu:
    system priority: 32768
    system mac address: aa:bb:cc:00:01:00
    oper key: 1
    port priority: 32768
    port number: 1
    port state: 61

Slave Interface: enp0s9
MII Status: up
Speed: 1000 Mbps
Duplex: full
Link Failure Count: 0
Permanent HW addr: 08:00:27:3a:18:93
Slave queue ID: 0
Aggregator ID: 1
Actor Churn State: none
Partner Churn State: none
Actor Churned Count: 0
Partner Churned Count: 0
details actor lacp pdu:
    system priority: 65535
    system mac address: 08:00:27:04:dd:bd
    port key: 9
    port priority: 255
    port number: 2
    port state: 61
details partner lacp pdu:
    system priority: 32768
    system mac address: aa:bb:cc:00:01:00
    oper key: 1
    port priority: 32768
    port number: 2
    port state: 61
LACPが確立されていることがわかる。
L2SW
Bonding状況
L2SW#show etherchannel summary
Flags:  D - down        P - bundled in port-channel
        I - stand-alone s - suspended
        H - Hot-standby (LACP only)
        R - Layer3      S - Layer2
        U - in use      f - failed to allocate aggregator

        M - not in use, minimum links not met
        u - unsuitable for bundling
        w - waiting to be aggregated
        d - default port


Number of channel-groups in use: 1
Number of aggregators:           1

Group  Port-channel  Protocol    Ports
------+-------------+-----------+-----------------------------------------------
1      Po1(SU)         LACP      Et0/0(P)    Et0/1(P)

L2SW#show etherchannel load-balance
EtherChannel Load-Balancing Configuration:
        src-dst-ip

EtherChannel Load-Balancing Addresses Used Per-Protocol:
Non-IP: Source XOR Destination MAC address
  IPv4: Source XOR Destination IP address
  IPv6: Source XOR Destination IP address
こちらも、LACPが確立されていることがわかる。
LACP
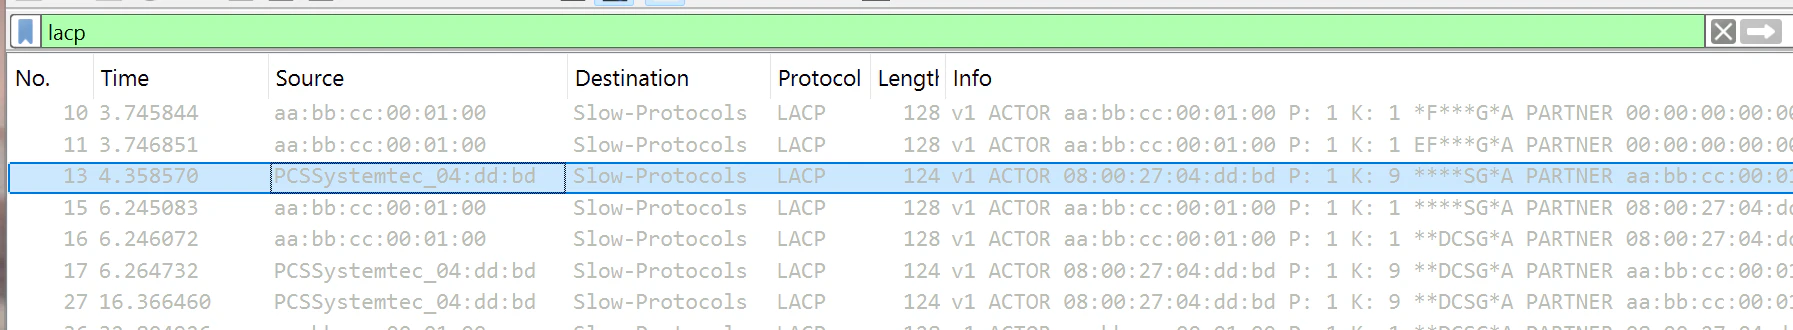
Wiresharkで取得したデータ(Proxmox-L2SW間)にLACPが見える。
負荷分散
IPアドレスやMacアドレスなどにより、通信が分散されていることを、Wiresharkで取得したデータ(Proxmox-L2SW間の2か所)で確認。端末間でpingの実施(下記はサンプル)。
root@debian10:~# ping 192.168.1.1 -c 3
PING 192.168.1.1 (192.168.1.1) 56(84) bytes of data.
64 bytes from 192.168.1.1: icmp_seq=1 ttl=64 time=6.85 ms
64 bytes from 192.168.1.1: icmp_seq=2 ttl=64 time=3.34 ms
64 bytes from 192.168.1.1: icmp_seq=3 ttl=64 time=2.96 ms

--- 192.168.1.1 ping statistics ---
3 packets transmitted, 3 received, 0% packet loss, time 2009ms
rtt min/avg/max/mdev = 2.957/4.383/6.849/1.750 ms
root@debian10:~#
root@debian10:~#
root@debian10:~# ping 192.168.1.2 -c 3
PING 192.168.1.2 (192.168.1.2) 56(84) bytes of data.
64 bytes from 192.168.1.2: icmp_seq=1 ttl=64 time=5.92 ms
64 bytes from 192.168.1.2: icmp_seq=2 ttl=64 time=5.83 ms
64 bytes from 192.168.1.2: icmp_seq=3 ttl=64 time=2.78 ms

--- 192.168.1.2 ping statistics ---
3 packets transmitted, 3 received, 0% packet loss, time 2004ms
rtt min/avg/max/mdev = 2.777/4.843/5.918/1.461 ms
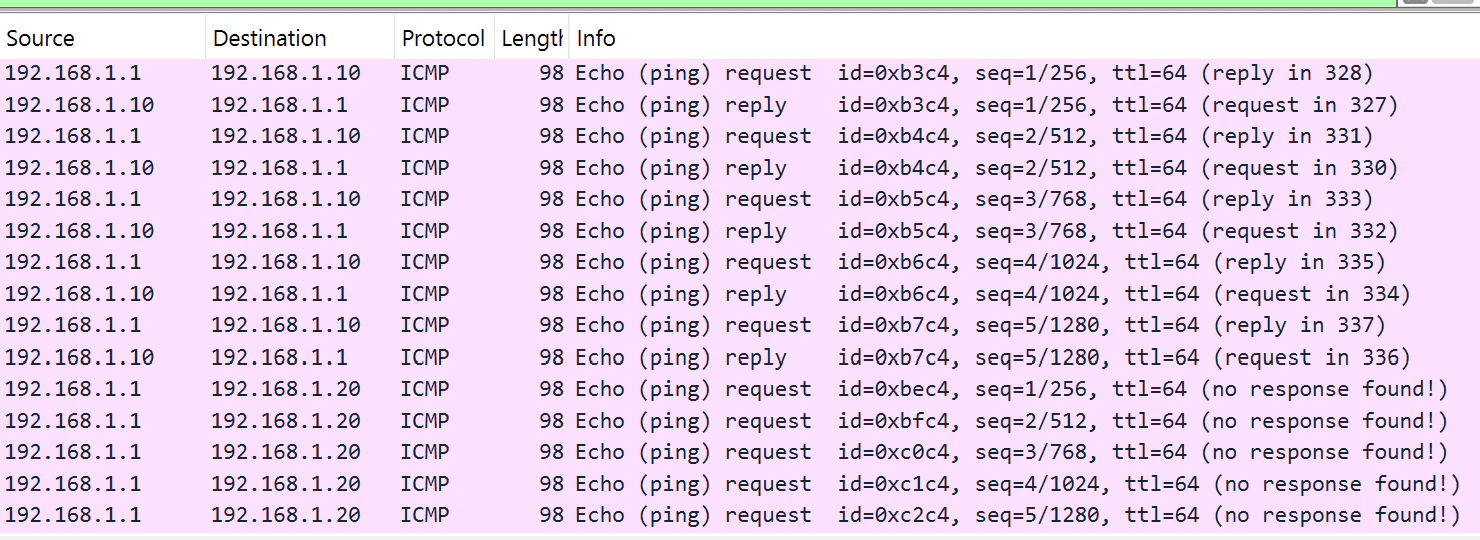
ネットワークデータ。1番目の回線(e0/0-enp0s8)の状況。
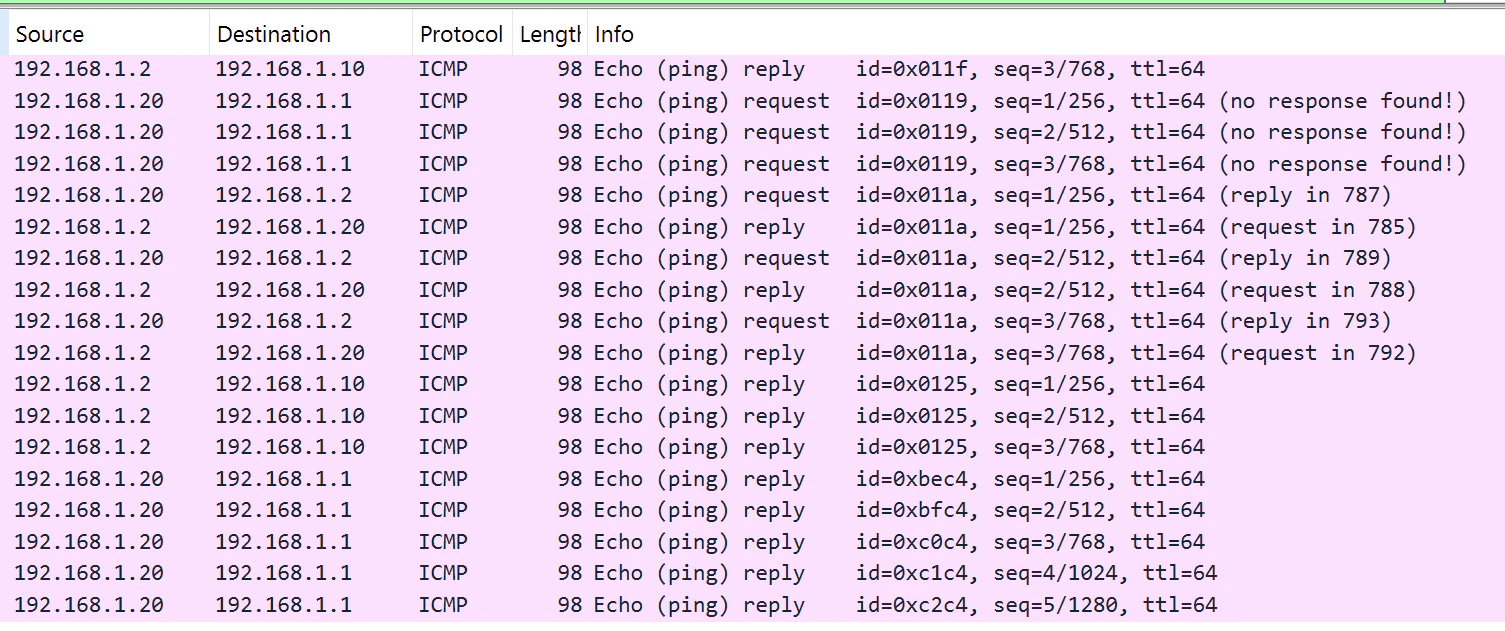
2番目の回線(e0/1-enp0s9)の状況。
RequestとReplyとが別ルートになっていることもあるようだ。また、ホストにおける、各I/FのTXおよびRXの状況を下記。
# ip -s link show enp0s8
3: enp0s8: <BROADCAST,MULTICAST,SLAVE,UP,LOWER_UP> mtu 1500 qdisc fq_codel master bond0 state UP mode DEFAULT group default qlen 1000
    link/ether 08:00:27:04:dd:bd brd ff:ff:ff:ff:ff:ff
    RX:  bytes packets errors dropped  missed   mcast
         83201    1108      0       0       0    1086
    TX:  bytes packets errors dropped carrier collsns
          8806      80      0       0       0       0
    altname enx08002704ddbd
#
# ip -s link show enp0s9
4: enp0s9: <BROADCAST,MULTICAST,SLAVE,UP,LOWER_UP> mtu 1500 qdisc fq_codel master bond0 state UP mode DEFAULT group default qlen 1000
    link/ether 08:00:27:04:dd:bd brd ff:ff:ff:ff:ff:ff permaddr 08:00:27:3a:18:93
    RX:  bytes packets errors dropped  missed   mcast
         33531     268      0       0       0     223
    TX:  bytes packets errors dropped carrier collsns
         10998     104      0       0       0       0
    altname enx0800273a1893
分散していることがわかる。
EOF