TWAMPによるネットワークパフォーマンス測定
TWAMPとはネットワークのパフォーマンスを計測する仕組み。具体的には、遅延やパケットロスを測定する。ここでは、GNS3上のVMなどを使って実現。
参考
- TWAMPとは何か?どのように動作するのか、利点と制限事項を分かりやすく解説
- TWAMP-lightとは?シンプルなネットワーク測定の仕組みと使い方を徹底解説!
- RFC 5357 - A Two-Way Active Measurement Protocol (TWAMP) 日本語訳
環境
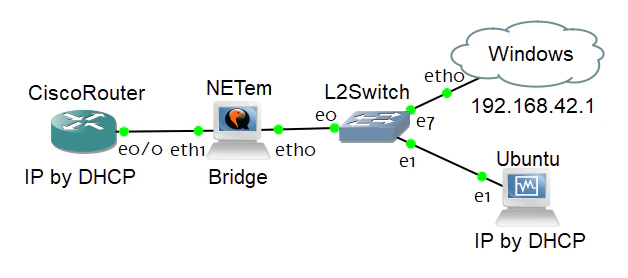
GNS3上でネットワークを構築。
- CiscoRouter(TWAMP Responder(Server))
- ホストOSへのネットワークブリッジ(Windows Client)
- Ubuntu VM(Linux Client)
- NETem VM(ネットワーク遅延、パケットロスの実現するネットワークブリッジ)
設定
TWAMP Server: Cisco Router
上記を参考に設定した内容は下記である。
interface Ethernet0/0
 ip address dhcp

ip sla responder twamp
ip sla responder
ip sla server twamp
TWAMP Client: Linux(Ubuntu)
twpingというコマンドを利用。perfSONARというパッケージ(?)に含まれている。
ChatGPTに聞きながらインストール。
$ sudo add-apt-repository universe
$ sudo curl -o /etc/apt/sources.list.d/perfsonar-release.list https://downloads.perfsonar.net/debian/perfsonar-release.list
$ sudo curl -s -o /etc/apt/trusted.gpg.d/perfsonar-release.gpg.asc https://downloads.perfsonar.net/debian/perfsonar-release.gpg.key
$ sudo apt update
$ sudo apt install perfsonar-tools
TWAMP Client: Windows
Windowsのクライアントは上記を利用。画面などは後述。
NETem
GNS3 VMであるNETem(Linux tcコマンド)により、遅延・ジッタやパケットロスの状況を作る。
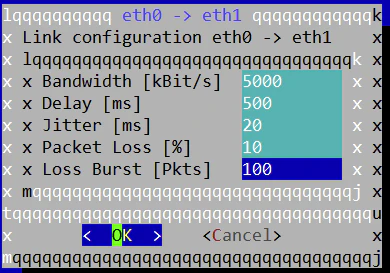
- Bandwidth: 5Mbps
- Delay: 500ms
- Jitter: 20ms
- Packet Loss: 10%
- Packet Burst: 100Pkts
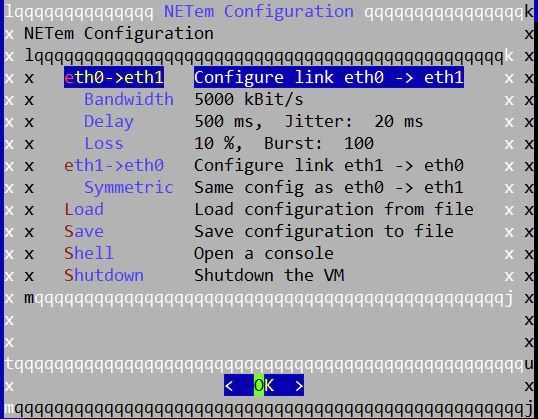
上記の設定を行った状況を、後述では、「Filterあり」と表記。
検証
Linux
twpingの結果である。
Filterなし
Approximately 13.0 seconds until results available

Directional delays may be inaccurate due to out of sync clocks!

--- twping statistics from [192.168.42.132]:9193 to [192.168.42.130]:9193 ---
SID:	c0a82a82ec98b65d01cac0836e17153d
first:	2025-10-14T11:45:33.976
last:	2025-10-14T11:45:43.631
100 sent, 0 lost (0.000%), 0 send duplicates, 0 reflect duplicates
round-trip time min/median/max = 0.665/1.7/5.75 ms, (err=4.29e+12 ms)
send time min/median/max = 0.666/77.7/80.6 ms, (err=2.15e+12 ms)
reflect time min/median/max = -77.3/-75.9/0.487 ms, (err=2.15e+12 ms)
reflector processing time min/max = 0/0 ms
two-way jitter = 1.8 ms (P95-P50)
send jitter = 1.7 ms (P95-P50)
reflect jitter = 75.5 ms (P95-P50)
send hops = 1 (consistently)
reflect hops = 0 (consistently)
妨げるものは何もないので、こんなものであろう。
Filterあり
Approximately 16.0 seconds until results available

--- twping statistics from [192.168.42.132]:9190 to [192.168.42.130]:9190 ---
SID:	c0a82a82ec98bc07f58106243589b5f0
first:	2025-10-14T12:09:47.599
last:	2025-10-14T12:09:58.967
100 sent, 0 lost (0.000%), 0 send duplicates, 0 reflect duplicates
round-trip time min/median/max = 967/1e+03/1.04e+03 ms, (err=4.29e+12 ms)
send time min/median/max = 359/376/400 ms, (err=2.15e+12 ms)
reflect time min/median/max = 604/624/645 ms, (err=2.15e+12 ms)
reflector processing time min/max = 0/1 ms
two-way jitter = 23.4 ms (P95-P50)
send jitter = 21.2 ms (P95-P50)
reflect jitter = 18.8 ms (P95-P50)
send hops = 1 (consistently)
reflect hops = 0 (consistently)
遅延やジッタ値がそれになりになっているのはわかるが、パケットロスが0%となっていることは不明(詳細未調査)。
Windows
twamp-guiの結果である。
Filterなし
開始時の状況は下記。
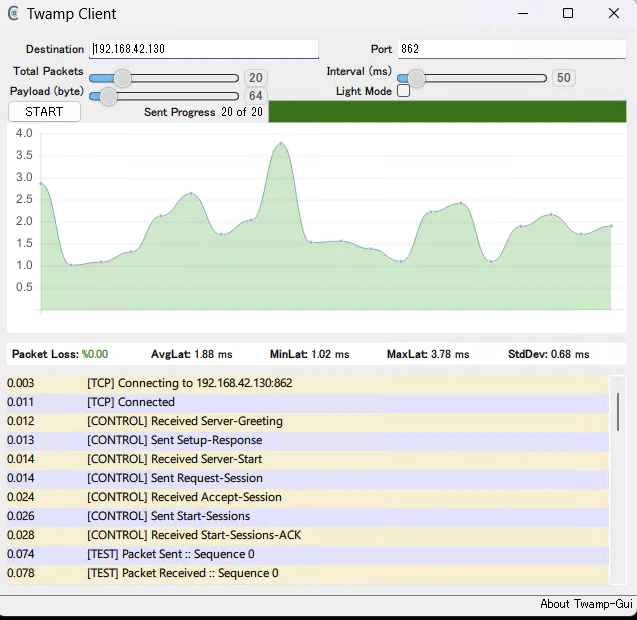
縦軸は遅延(応答時間)。なぜか、50%のパケットロス。詳細不明(未調査)。
参考までに終了時の状況は下記となる。
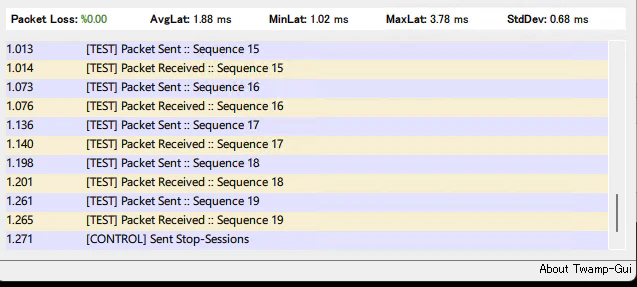
Filterあり

1000(=500x2)ms(設定したDelayの2倍)の応答時間が見える。
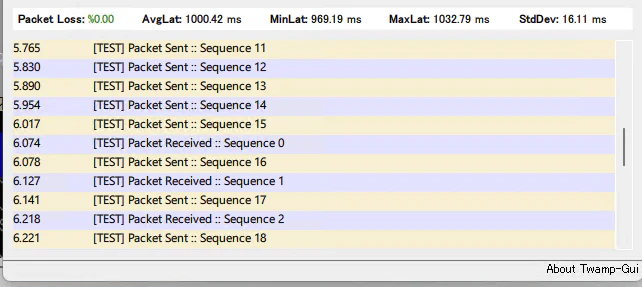
パケット応答が遅れている状況が見える。
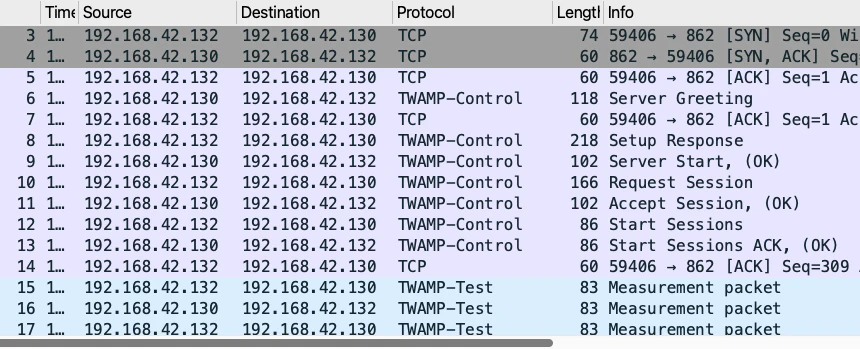
Wiresharkで取得したキャプチャデータ
開始時シーケンスは下記であり、TCPによる制御セッションから始まり、その後、UDPによるテストが行われる。
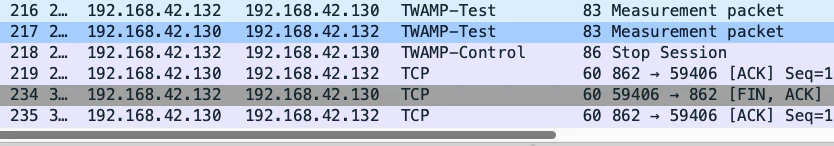
終了時シーケンスは下記となる。
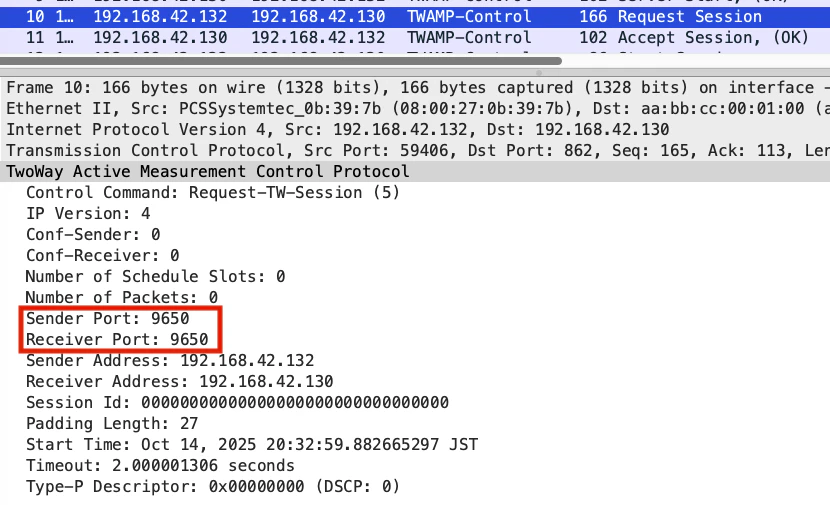
また、制御シーケンス内で、テストシーケンス内で使われる、UDPポート番号が指定されている。
テストシーケンス内のデータは下記。
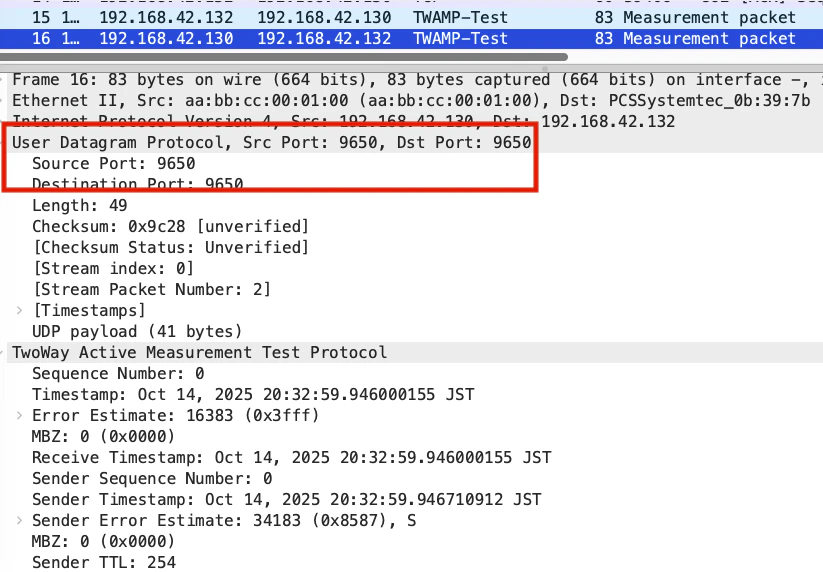
Wiresharkで取得したデータを見ると、シーケンス内容だけでは何も判断できないと思われる。プロトコルの規定に従って、TWAMPクライアントアプリケーション内で、遅延・ジッタやパケットロス率などを判断(計算)していると推測(詳細未調査)。
終わりに
まとまりのない話となってしまった。適切に利用すれば、それなりに使えるのであろう。