概要
- M5GOで付属の環境センサー(DHT12、BMP280)から値を取得
- M5GOとChromeをBluetooth LEで接続
- M5GOからBLEのNotifyにて環境センサー値をChromeへ通知
- Chrome側で取得した環境センサー値をGoogle Chartsで表示
その後、M5Stack UIFlow (MicroPython) で実装してみたのが以下
M5Stack UIFlowのBLE UARTでChromeと接続し環境センサー値をGoogle Chartsで表示
環境
- M5GO (Arduino IDE 1.8.7)
- iMac (macOS High Sierra)
- Google Chrome (69.0.3497.100)
実行結果
-
HTMLを直接Chromeで開く
-
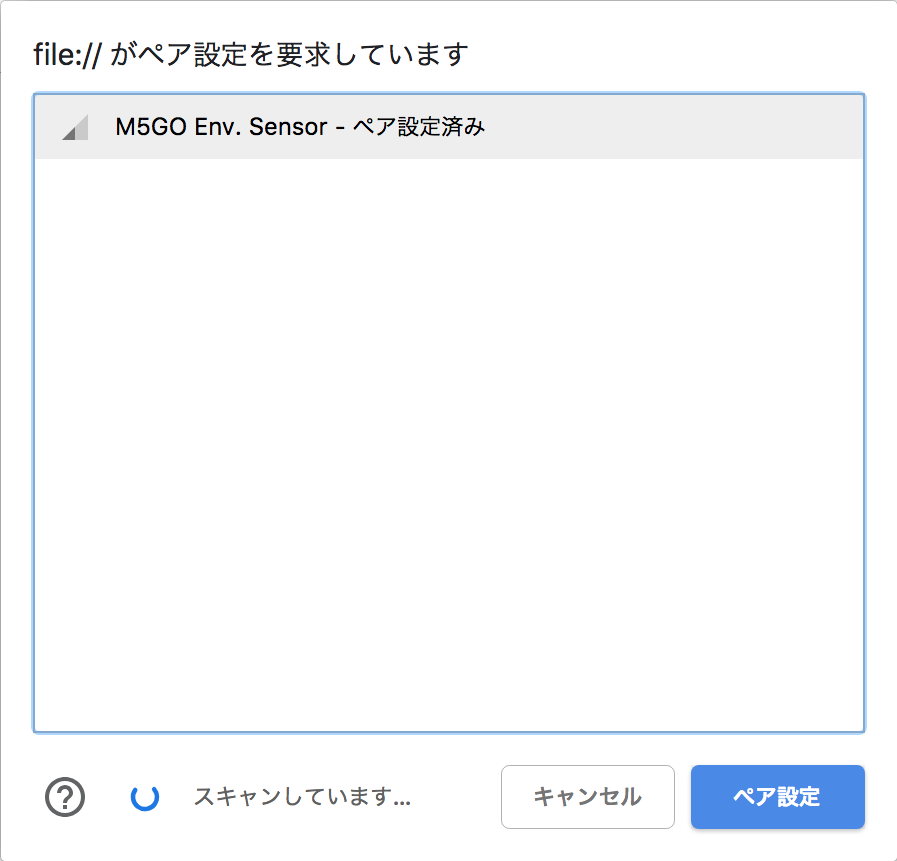
BLEでの接続用ボタン
 をクリック(ユーザ操作無しでの接続は不可)
 -
「M5GO Env. Sensor」とペア設定
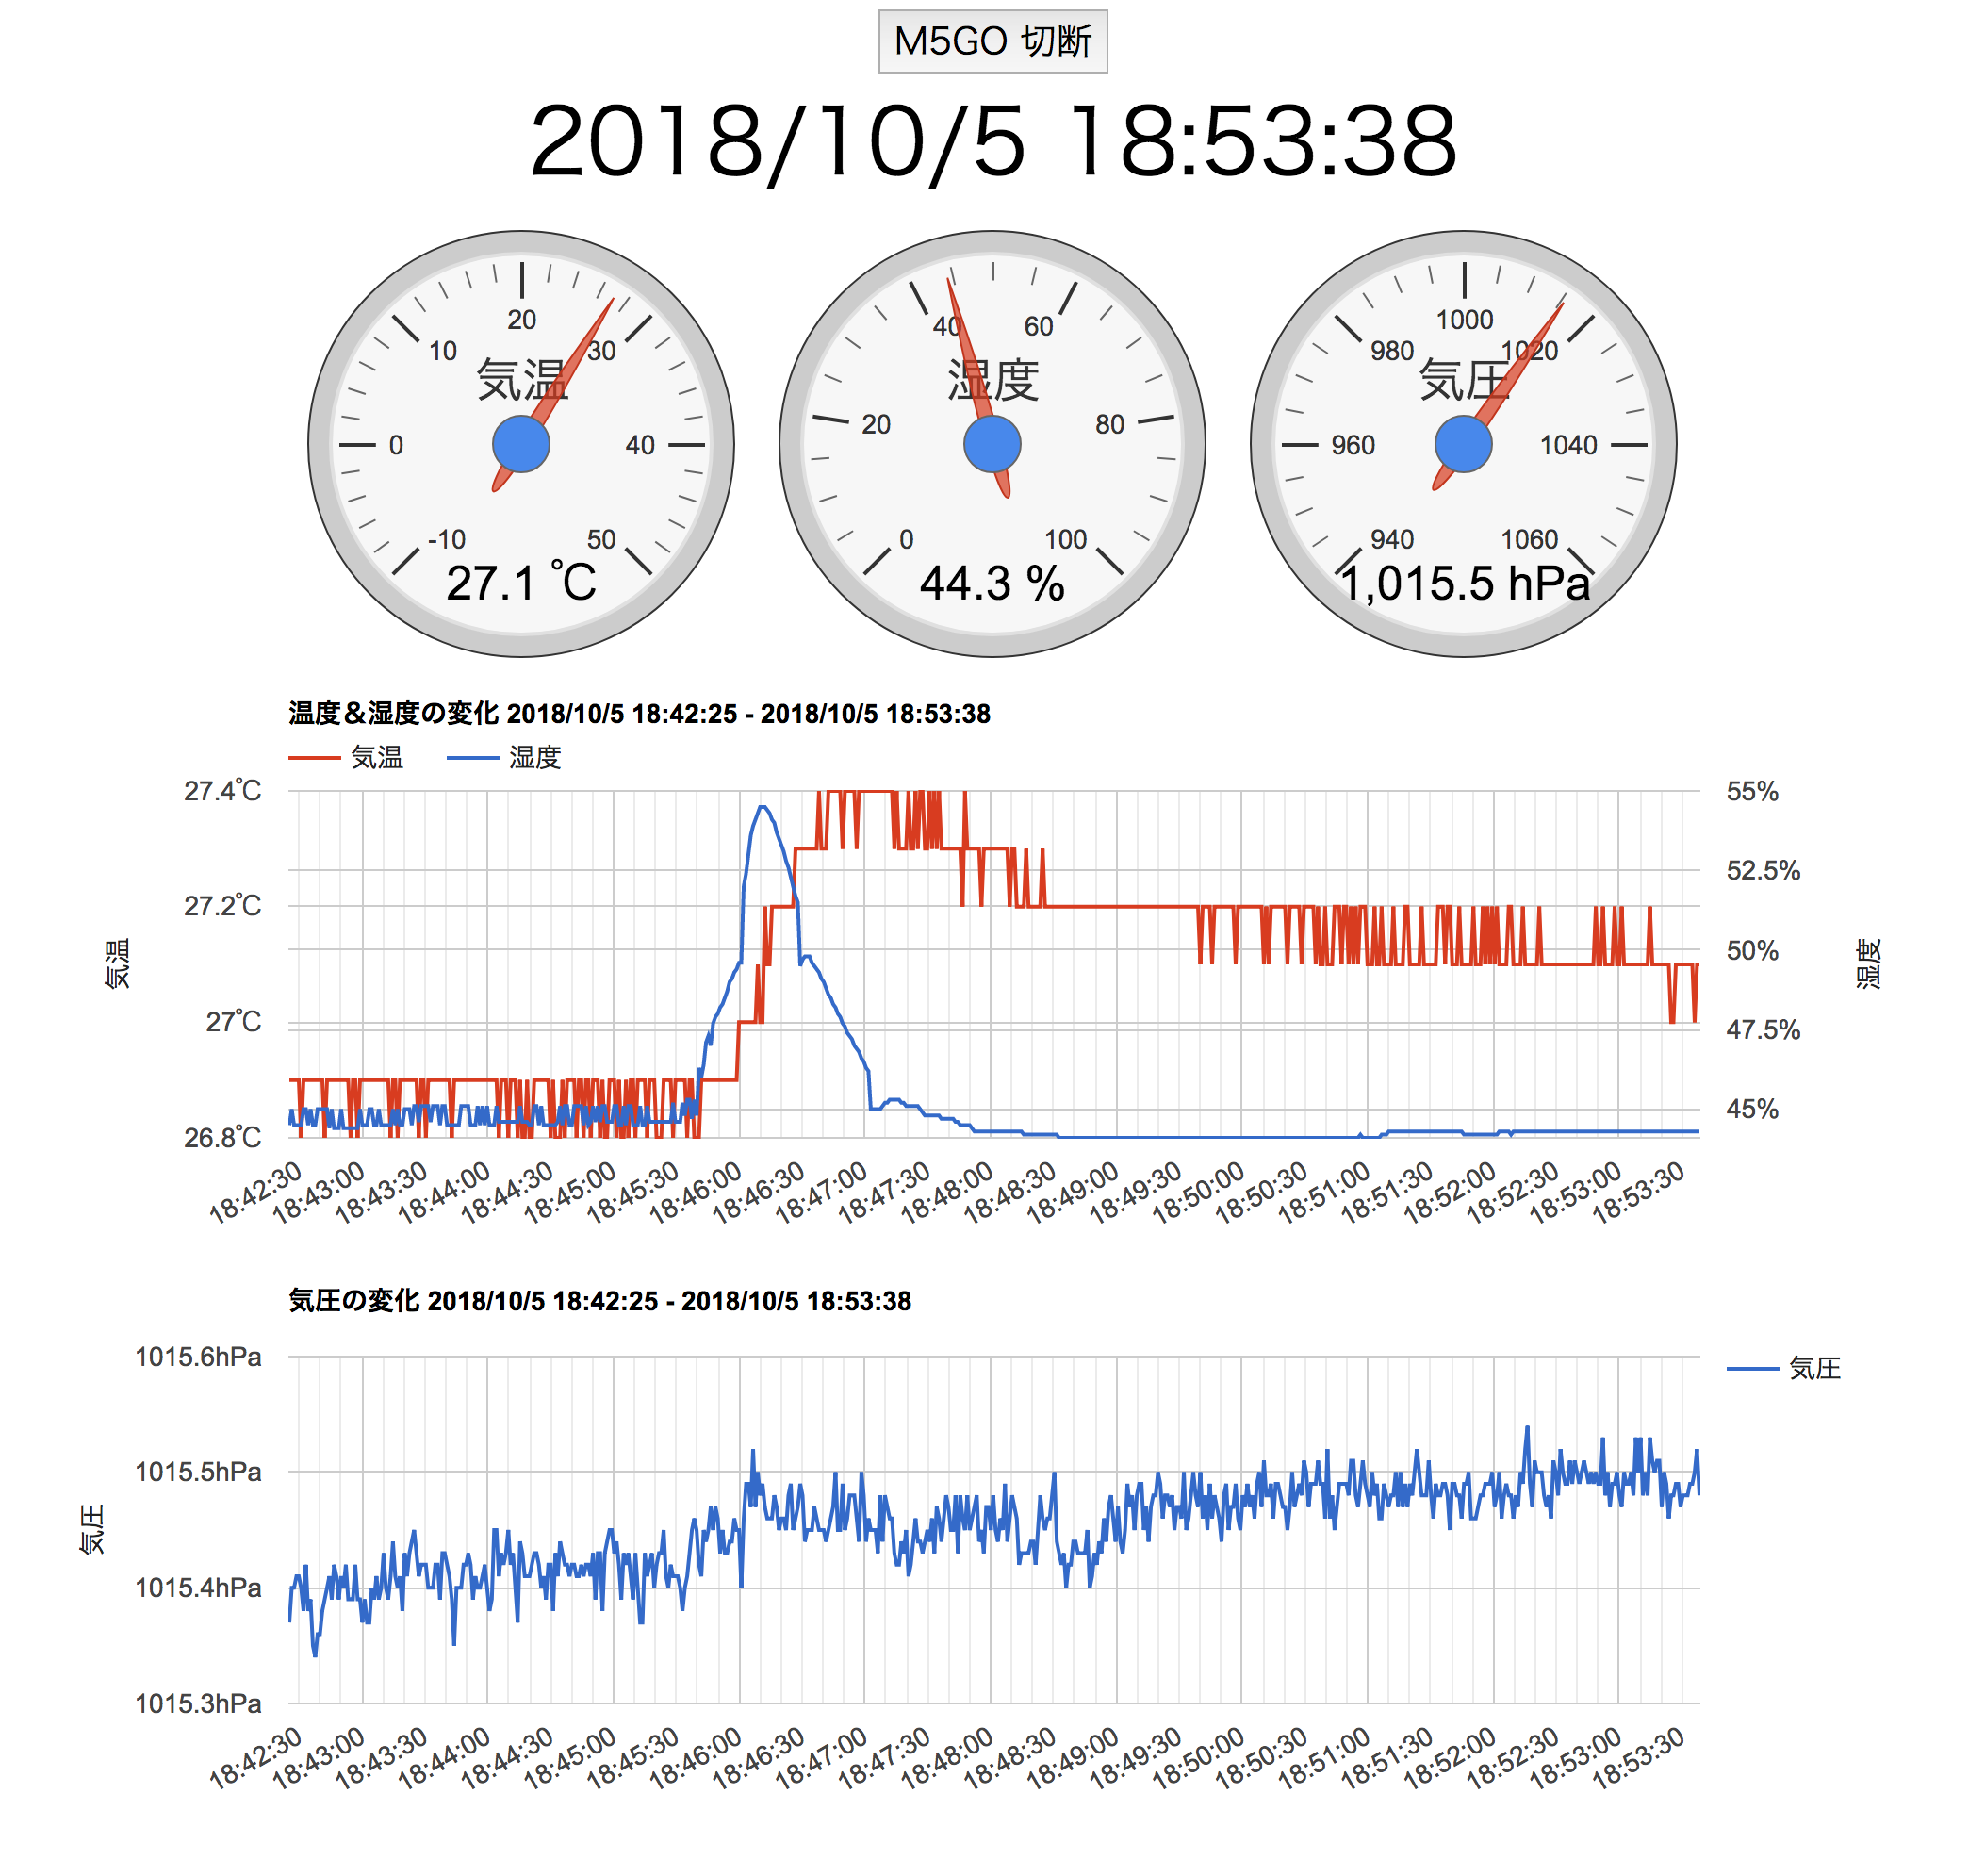
- M5GOからBLE経由で送られてくる気温・湿度・気圧値をGoogle Chartsで表示
M5GO側プログラム
DHT12用のモジュール(DHT12.cpp/DHT12.h)はこちらを使用
https://github.com/m5stack/M5Stack/tree/master/examples/Modules/DHT12
BMP280用のモジュール(Seeed_BMP280.cpp/Seeed_BMP280.h)はこちらを使用
https://github.com/Seeed-Studio/Grove_BMP280
Seeed_BMP280.hでBMP280_ADDRESSが「0x77」となっているので「0x76」に変更
          :          :
# define BMP280_ADDRESS   0x76 // 0x77 -> 0x76 for M5GO Env Sensor
          :          :
# include <M5Stack.h>
# include "DHT12.h"
# include "Seeed_BMP280.h"
# include <Wire.h>

DHT12 dht12;
BMP280 bmp280;

void setup() {
    M5.begin();
    Wire.begin();
    if (!bmp280.init()) {
      Serial.println("BMP280 Device error!");
    }

    M5.Lcd.fillScreen(BLACK);
    M5.Lcd.setTextColor(WHITE ,BLACK); // Set pixel color; 1 on the monochrome screen
    M5.Lcd.setTextSize(2);

    M5.Lcd.setCursor(10,  20); M5.Lcd.print("Not Connected");
    M5.Lcd.setCursor(10,  50); M5.Lcd.print("DHT12");
    M5.Lcd.setCursor(30,  80); M5.Lcd.print("humidity:");
    M5.Lcd.setCursor(30, 110); M5.Lcd.print("temperature:");
    M5.Lcd.setCursor(10, 140); M5.Lcd.print("BMP280");
    M5.Lcd.setCursor(30, 170); M5.Lcd.print("temperature:");
    M5.Lcd.setCursor(30, 200); M5.Lcd.print("pressure:");

    initBLE();
}

void loop() {
    char buf[50];
    float dht12_t;
    float dht12_h;
    float bmp280_t;
    float bmp280_p;

    M5.update();

    for (int i = 0; i < 3; i++) {
        dht12_t  = dht12.readTemperature();
        dht12_h  = dht12.readHumidity();

        // dht12 の戻り値が 0.01, 0.02, 0.03 の場合はエラーのためリトライする
        if ((dht12_t == 0 || dht12_t > 0.03) &&
            (dht12_h == 0 || dht12_h > 0.03))
            break;

        Serial.printf("DHT12 Error: %.2f, %.2f\n", dht12_t, dht12_h);
    }
    bmp280_t = bmp280.getTemperature();
    bmp280_p = bmp280.getPressure() / 100.0;

    Serial.printf("%.1f, %.1f, %.2f, %.2f\n", dht12_t, dht12_h, bmp280_t, bmp280_p);
    M5.Lcd.setCursor(180,  80); M5.Lcd.printf("%.2f%%  ",  dht12_h);
    M5.Lcd.setCursor(180, 110); M5.Lcd.printf("%.2fC  ",   dht12_t);
    M5.Lcd.setCursor(180, 170); M5.Lcd.printf("%.2fC  ",   bmp280_t);
    M5.Lcd.setCursor(180, 200); M5.Lcd.printf("%.2fhPa  ", bmp280_p);

    // BLE 経由で通知する値として DHTの気温/湿度とBMP280の気圧を使用
    // BMP280の気温は高めの値が返ってきているので使用していない
    // データは文字列で送信
    sprintf(buf, "%.1f,%.1f,%.2f", dht12_t, dht12_h, bmp280_p);
    loopBLE(buf);

    delay(1000);
}


///////////////////
// Bluetooth LE  //
///////////////////
# include <BLEDevice.h>
# include <BLEServer.h>
# include <BLEUtils.h>
# include <BLE2902.h>

BLEServer *pServer = NULL;
BLECharacteristic *pNotifyCharacteristic;
bool deviceConnected = false;
bool oldDeviceConnected = false;

# define LOCAL_NAME "M5GO Env. Sensor"

// See the following for generating UUIDs:
// https://www.uuidgenerator.net/
# define SERVICE_UUID          "c44205a6-c87c-11e8-a8d5-f2801f1b9fd1"
# define CHARACTERISTIC_UUID   "c442090c-c87c-11e8-a8d5-f2801f1b9fd1"

// Bluetooth LE Change Connect State
class MyServerCallbacks: public BLEServerCallbacks {
    void onConnect(BLEServer* pServer) {
      Serial.println("Device Connected");
      deviceConnected = true;
    };

    void onDisconnect(BLEServer* pServer) {
      Serial.println("Device Disconnected");
      deviceConnected = false;
    }
};

// Bluetooth LE initialize
void initBLE() {
    // Create the BLE Device
    BLEDevice::init(LOCAL_NAME);

    // Create the BLE Server
    pServer = BLEDevice::createServer();
    pServer->setCallbacks(new MyServerCallbacks());

    // Create the BLE Service
    BLEService *pService = pServer->createService(SERVICE_UUID);

    // Create a BLE Characteristic
    pNotifyCharacteristic = pService->createCharacteristic(
                          CHARACTERISTIC_UUID,
                          BLECharacteristic::PROPERTY_NOTIFY
                          );
    pNotifyCharacteristic->addDescriptor(new BLE2902());

    // Start the service
    pService->start();

    // Start advertising
    pServer->getAdvertising()->start();
    Serial.println("Start Advertising");
}

// Bluetooth LE loop
void loopBLE(char* buf) {
    // disconnecting
    if (!deviceConnected && oldDeviceConnected) {
        M5.Lcd.setCursor(10,  20); M5.Lcd.print("Not Connected");
        delay(500); // give the bluetooth stack the chance to get things ready
        pServer->startAdvertising(); // restart advertising
        Serial.println("Start Advertising");
        oldDeviceConnected = deviceConnected;
    }
    // connecting
    if (deviceConnected && !oldDeviceConnected) {
        M5.Lcd.setCursor(10,  20); M5.Lcd.print("Connected    ");
        // do stuff here on connecting
        oldDeviceConnected = deviceConnected;
    }
    if (deviceConnected) {
        pNotifyCharacteristic->setValue(buf);
        pNotifyCharacteristic->notify();
    }
}
Chrome側プログラム
<html>
    <head>
        <title>気温・湿度・気圧計 - Google Charts</title>
        <script type="text/javascript" src="https://www.gstatic.com/charts/loader.js"></script>
        <script type="text/javascript">
            google.charts.load('current', {'packages':['gauge', 'corechart']});
            google.charts.setOnLoadCallback(chartSetup);

            var optionGaugeT = {
                    width: 250, height: 250,
                    min: -10, max: 50,
                    majorTicks: ["-10", "0", "10", "20", "30", "40", "50"],
                    minorTicks: 5
                };
            var optionGaugeH = {
                    width: 250, height: 250,
                    min: 0, max: 100,
                    majorTicks: ["0", "20", "40", "60", "80", "100"],
                    minorTicks: 4
                };
            var optionGaugeP = {
                    width: 250, height: 250,
                    min: 940, max: 1060,
                    majorTicks: ["940", "960", "980", "1000", "1020", "1040", "1060"],
                    minorTicks: 4
                };
            var optionLineTH = {
                    title: '気温&湿度の変化',
                    width: 1000,
                    height: 300,
                    colors: ['#DC3912', '#3366CC'],
                    // Gives each series an axis that matches the vAxes number below.
                    series: {
                        0: {targetAxisIndex: 0},
                        1: {targetAxisIndex: 1}
                    },
                    vAxes: {
                      // Adds titles to each axis.
                        0: {title: '気温',
                            format: '#.#℃'},
                        1: {title: '湿度',
                            format: '#.#%'}
                    },
                    hAxis: {
                        format: 'HH:mm:ss'
                    },
                    vAxis: {
                        titleTextStyle: {italic: false}
                    }
                };

            var optionLineP = {
                    title: '気圧の変化',
                    width: 1000,
                    height: 300,
                    // Gives each series an axis that matches the vAxes number below.
                    series: {
                        0: {targetAxisIndex: 0}
                    },
                    vAxes: {
                      // Adds titles to each axis.
                        0: {title: '気圧',
                            format: '#.#hPa'}
                    },
                    hAxis: {
                        format: 'HH:mm:ss'
                    },
                    vAxis: {
                        titleTextStyle: {italic: false}
                    }
                };

            var dataGaugeT;
            var dataGaugeH;
            var dataGaugeP;
            var dataLineTH;
            var dataLineP;

            var chartGaugeT;
            var chartGaugeH;
            var chartGaugeP;
            var chartLineTH;
            var chartLineP;

            var formatterT;
            var formatterH;
            var formatterP;

            function chartSetup() {
                dataGaugeT = google.visualization.arrayToDataTable([
                        ['Label', 'Value'],
                        ['気温', 0]
                    ]);
                dataGaugeH = google.visualization.arrayToDataTable([
                        ['Label', 'Value'],
                        ['湿度', 0]
                    ]);
                dataGaugeP = google.visualization.arrayToDataTable([
                        ['Label', 'Value'],
                        ['気圧', 0]
                  ]);

                dataLineTH = new google.visualization.DataTable();
                dataLineTH.addColumn('datetime', '日時');
                dataLineTH.addColumn('number',   '気温');
                dataLineTH.addColumn('number',   '湿度');

                dataLineP = new google.visualization.DataTable();
                dataLineP.addColumn('datetime', '日時');
                dataLineP.addColumn('number',   '気圧');

                chartGaugeT = new google.visualization.Gauge(document.getElementById('gauge_chart_temperature'));
                chartGaugeH = new google.visualization.Gauge(document.getElementById('gauge_chart_humidity'));
                chartGaugeP = new google.visualization.Gauge(document.getElementById('gauge_chart_pressure'));
                chartLineTH = new google.visualization.LineChart(document.getElementById('line_chart_temp_hum'));
                chartLineP  = new google.visualization.LineChart(document.getElementById('line_chart_pressure'));

                formatterT = new google.visualization.NumberFormat({suffix:' ℃', fractionDigits:1});
                formatterH = new google.visualization.NumberFormat({suffix:' %', fractionDigits:1});
                formatterP = new google.visualization.NumberFormat({suffix:' hPa', fractionDigits:1});

                updateCharts(undefined, undefined, undefined);
            }

            function updateCharts(t, h, p) {
                serverTime = new Date();
                document.getElementById('datetime').innerHTML=serverTime.toLocaleString();

                if (t === undefined) {
                    optionLineTH['title'] = '気温&湿度の変化';
                    optionLineP['title']  = '気圧の変化';
                } else {
                    dataGaugeT.setValue(0, 1, t);
                    dataGaugeH.setValue(0, 1, h);
                    dataGaugeP.setValue(0, 1, p);

                    dataLineTH.addRow([serverTime, t, h / 100])
                    if (dataLineTH.getNumberOfRows() > 600)
                        dataLineTH.removeRow(0)

                    dataLineP.addRow([serverTime, p])
                    if (dataLineP.getNumberOfRows() > 600)
                        dataLineP.removeRow(0)

                    optionLineTH['title'] = '気温&湿度の変化  '
                                        + dataLineTH.getValue(0, 0).toLocaleString()
                                        + ' - '
                                        + dataLineTH.getValue(dataLineTH.getNumberOfRows()-1, 0).toLocaleString();

                    optionLineP['title'] = '気圧の変化  '
                                        + dataLineP.getValue(0, 0).toLocaleString()
                                        + ' - '
                                        + dataLineP.getValue(dataLineP.getNumberOfRows()-1, 0).toLocaleString();
                }
                formatterT.format(dataGaugeT, 1);
                formatterH.format(dataGaugeH, 1);
                formatterP.format(dataGaugeP, 1);

                chartGaugeT.draw(dataGaugeT, optionGaugeT);
                chartGaugeH.draw(dataGaugeH, optionGaugeH);
                chartGaugeP.draw(dataGaugeP, optionGaugeP);
                chartLineTH.draw(dataLineTH, optionLineTH);
                chartLineP.draw(dataLineP, optionLineP);
            }

            var bluetoothDevice;
            var characteristic;
            var service;

            var SERVICE_UUID        = 'c44205a6-c87c-11e8-a8d5-f2801f1b9fd1';
            var CHARACTERISTIC_UUID = 'c442090c-c87c-11e8-a8d5-f2801f1b9fd1';

            function toggle_connection() {
                if (!bluetoothDevice || !bluetoothDevice.gatt.connected)
                    connect();
                else
                    disconnect();
            }

            //BEL接続処理
            function connect() {
                let options = {};

                options.filters = [
                    {services: [SERVICE_UUID]},
                    {name: "M5GO Env. Sensor"}
                ];

                navigator.bluetooth.requestDevice(options)
                .then(device => {
                    bluetoothDevice = device;
                    console.log("device", device);
                    return device.gatt.connect();
                })
                .then(server =>{
                    console.log("server", server)
                    return server.getPrimaryService(SERVICE_UUID);
                })
                .then(serv => {
                    service = serv;
                    console.log("service", service)
                    return service.getCharacteristic(CHARACTERISTIC_UUID)
                })
                .then(chara => {
                    document.getElementById('toggle_connection').innerHTML = "M5GO 切断";
                    console.log("characteristic", chara)
                    characteristic = chara;
                    characteristic.addEventListener('characteristicvaluechanged', onRecvSensorData);
                            characteristic.startNotifications();
                })
                .catch(error => {
                    console.log(error);
                });
            }

            //BEL切断処理
            function disconnect() {
                document.getElementById('toggle_connection').innerHTML = "M5GO 接続";
                if (!bluetoothDevice || !bluetoothDevice.gatt.connected) return;
                bluetoothDevice.gatt.disconnect();
            }

            function onRecvSensorData(event) {
                let characteristic = event.target;
                let value = characteristic.value;
                let decoder = new TextDecoder('utf-8');

                m5go_env = decoder.decode(value).split(',')
                // m5go_env[0] Temperature from DHT12
                // m5go_env[1] Humidity    from DHT12
                // m5go_env[2] Pressure    from BMP280
                console.log(m5go_env[0] + ', ' + m5go_env[1] + ', ' + m5go_env[2])

                updateCharts(Number(m5go_env[0]), Number(m5go_env[1]), Number(m5go_env[2]));
            }

       </script>
    </head>
    <body>
        <div style="width: 1000px; margin: 0 auto;">
            <div style="text-align: center;">
                <button id="toggle_connection" style="font-size: 120%; font-family: sans-serif;" onClick="toggle_connection()">M5GO 接続</button>
            </div>
            <div id="datetime" style="text-align: center; font-size: 300%; font-family: sans-serif;"></div>
            <div style=" display:flex;justify-content: center;">
                <div id="gauge_chart_temperature"></div>
                <div id="gauge_chart_humidity"></div>
                <div id="gauge_chart_pressure"></div>
            </div>
            <div id="line_chart_temp_hum"></div>
            <div id="line_chart_pressure"></div>
        </div>
    </body>
</html>
補足
-
MicroPythonでM5GO付属の環境センサー(DHT12、BMP280)から値を取得して表示した結果

-
ArduinoでM5GO付属の環境センサー(DHT12、BMP280)から値を取得して表示した結果

MicroPythonによる表示の直後にArduinoで実行したが、BMP280の気温の値が1.65度も高くなっている。BMP280のMicroPython用モジュールとArduino用モジュールの違いによるものと思われるが、両方のモジュールを見比べても何が影響しているのかは分かりませんでした。
実際の気温はMicroPythonのBMP280の気温に近いのですが、今回はBLEを使うためにArduinoを使用しており、気温についてはDHT12の値を使うことにしました。