目的
Titanicコンペで素振りをした後、もうひと素振りしてみる用。
その2:特徴量エンジニアリングはコチラ
参考にさせていただいたのは、こちらのNotebook
https://www.kaggle.com/gpreda/santander-eda-and-prediction
他にもっと精度が出ているNotebookもありましたが、最も評価されているコチラをまずは実行してみました。
概要
下の英文にも書いていますが、二値分類で購買しそうなユーザーを予測する。ようです。
At Santander our mission is to help people and businesses prosper. We are always looking for ways to help our customers understand their financial health and identify which products and services might help them achieve their monetary goals.
Our data science team is continually challenging our machine learning algorithms, working with the global data science community to make sure we can more accurately identify new ways to solve our most common challenge, binary classification problems such as: is a customer satisfied? Will a customer buy this product? Can a customer pay this loan?
In this challenge, we invite Kagglers to help us identify which customers will make a specific transaction in the future, irrespective of the amount of money transacted. The data provided for this competition has the same structure as the real data we have available to solve this problem.
- データ分析/探索
- 特徴量エンジニアリング
- モデル作成・評価
- サブミッション
の順に記載。
この記事では、データ分析/探索について記載した。残りはコチラ
データ分析/探索
データの読み込み
※全ての列を表示させたいので、max_columnsを設定しておく。
import pandas as pd
pd.set_option('display.max_columns',202)
train_df = pd.read_csv("input/train.csv")
test_df = pd.read_csv("input/test.csv")
データの次元数および数の確認
train_df.shape, test_df.shape
((200000, 202), (200000, 201))
trainデータは、202の次元数で200000データ数
testデータは201の次元数で200000のデータ数があることがわかる。
testデータは評価用のため、目的変数がないので、trainデータよりも次元数が-1になっている。
trainデータとtestデータの中身を確認する
train_df.head(2)

test_df.head(2)

欠損値と型の確認
train_dfとtest_dfの両方を確認するため、関数を定義して使い回す。
def missing_data(data):
    total = data.isnull().sum()
    percent = total/data.isnull().count()*100

    tt = pd.concat([total, percent], axis=1, keys=['Total', 'Percent'])
    types = []
    for col in data.columns:
        dtype = str(data[col].dtype)
        types.append(dtype)
    tt['Types'] = types
    return(np.transpose(tt))
欠損値の確認
train,testデータともに欠損値はないことが確認できた。
また、目的変数の"Target"はint型、特徴量の"var_XX"はfloat型であることが確認できた。
missing_data(train_df)

missing_data(test_df)

各特徴量の統計量の確認
まずはtrainデータから
train_df.describe()

続いてtestデータ

それぞれのmean,stdなどはtrainデータとtestデータでそんなに変わらなさそうなことが確認できた。
目的変数"Target"の分布を確認
sns.countplot(train_df['target'], palette='Set1')

0or1の値で0がほとんど、1の割合を確認してみる
print("There are {}% target values with 1".format(100 * train_df["target"].value_counts()[1]/train_df.shape[0]))
There are 10.049% target values with 1
10%程度が1である。
特徴量var_XXの0 or 1毎の分布を確認する。
可視化するための関数
seabornのdistplotメソッドで可視化する。
def plot_feature_distribution(df1, df2, label1, label2, features):
    i = 0
    sns.set_style('whitegrid')
    plt.figure()
    fig, ax = plt.subplots(10,10,figsize=(18,22))

    for feature in features:
        i += 1
        plt.subplot(10,10,i)
        sns.distplot(df1[feature], hist=False,label=label1)
        sns.distplot(df2[feature], hist=False,label=label2)
        plt.xlabel(feature, fontsize=9)
        locs, labels = plt.xticks()
        plt.tick_params(axis='x', which='major', labelsize=6, pad=-6)
        plt.tick_params(axis='y', which='major', labelsize=6)
    plt.show();
まずはvar_XXの前半100個
t0 = train_df.loc[train_df['target'] == 0]
t1 = train_df.loc[train_df['target'] == 1]
features = train_df.columns.values[2:102]
plot_feature_distribution(t0, t1, '0', '1', features)

続いて後半の100個
t0 = train_df.loc[train_df['target'] == 0]
t1 = train_df.loc[train_df['target'] == 1]
features = train_df.columns.values[102:202]
plot_feature_distribution(t0, t1, '0', '1', features)

表示を省略しているが、
二変量分布しているものなど、通常の正規分布とは異なる形状を示している変数もちらほらみられる。
特徴量var_XXのtrain,test毎の可視化
先ほどは、targetの値が0 or 1で分けてそれぞれの分布を可視化したが、
今度は、trainとtestデータ毎にそれぞれのvar_XXがどのような分布になるかを確認してみる。
後半の100個でやってみる
features = train_df.columns.values[102:202]
plot_feature_distribution(train_df, test_df, 'train', 'test', features)

trainデータとtestデータについては、お互いが乖離しているという状況ではなさそうである。
平均と標準偏差の分布
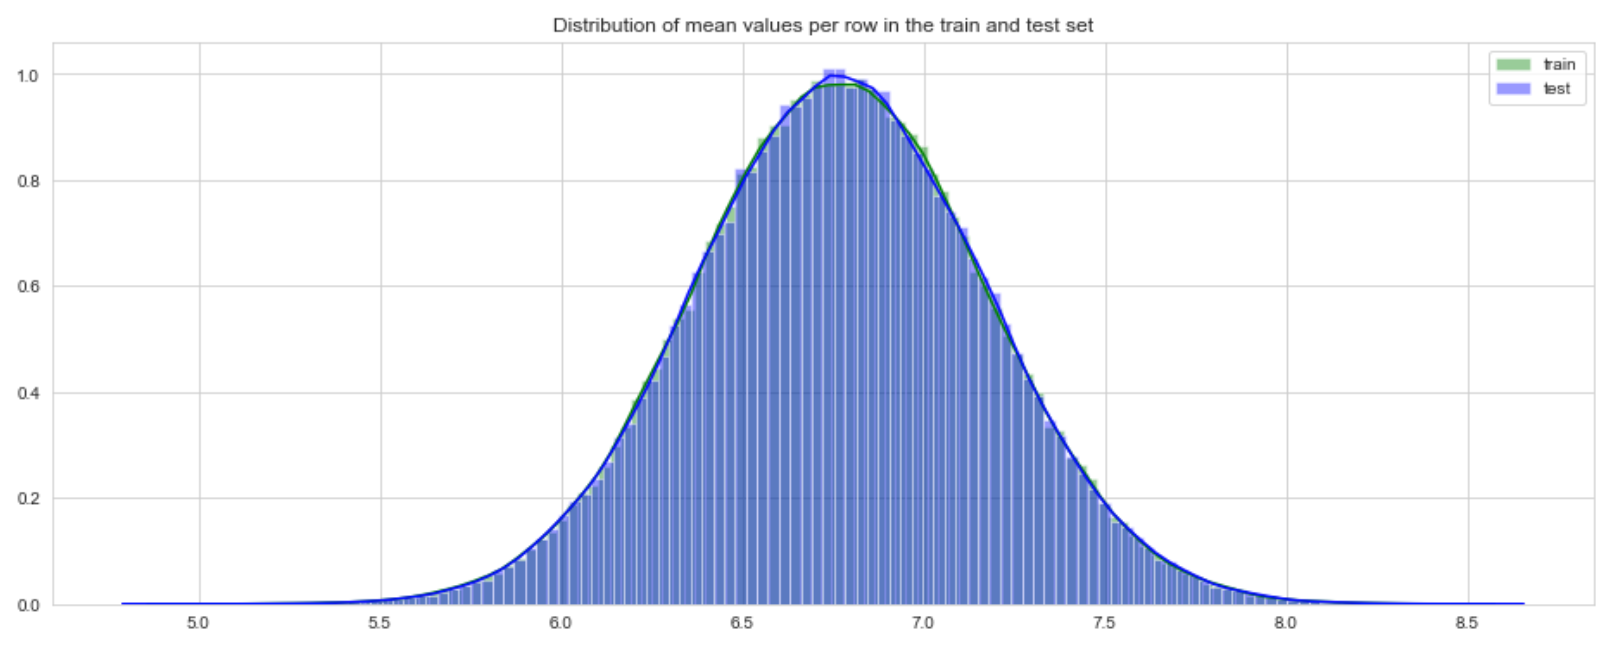
trainデータとtestデータの行毎の平均と標準偏差を可視化してみる。
まずは、平均
行毎の平均
plt.figure(figsize=(16,6))
features = train_df.columns.values[2:202]
plt.title("Distribution of mean values per row in the train and test set")
sns.distplot(train_df[features].mean(axis=1),color="green", kde=True,bins=120, label='train')
sns.distplot(test_df[features].mean(axis=1),color="blue", kde=True,bins=120, label='test')
plt.legend()
plt.show()
 trainデータとtestデータほぼほぼ一致していると言えそう。
列毎の平均
plt.figure(figsize=(16,6))
plt.title("Distribution of mean values per column in the train and test set")
sns.distplot(train_df[features].mean(axis=0),color="magenta",kde=True,bins=120, label='train')
sns.distplot(test_df[features].mean(axis=0),color="darkblue", kde=True,bins=120, label='test')
plt.legend()
plt.show()

続いて標準偏差
まずは行毎
plt.figure(figsize=(16,6))
plt.title("Distribution of std values per row in the train and test set")
sns.distplot(train_df[features].std(axis=1),color="black", kde=True,bins=120, label='train')
sns.distplot(test_df[features].std(axis=1),color="red", kde=True,bins=120, label='test')
plt.legend();plt.show()

続いて列毎
plt.figure(figsize=(16,6))
plt.title("Distribution of std values per column in the train and test set")
sns.distplot(train_df[features].std(axis=0),color="blue",kde=True,bins=120, label='train')
sns.distplot(test_df[features].std(axis=0),color="green", kde=True,bins=120, label='test')
plt.legend(); plt.show()

次は、targetの値別の平均を可視化してみる
まずは行毎
t0 = train_df.loc[train_df['target'] == 0]
t1 = train_df.loc[train_df['target'] == 1]
plt.figure(figsize=(16,6))
plt.title("Distribution of mean values per row in the train set")
sns.distplot(t0[features].mean(axis=1),color="red", kde=True,bins=120, label='target = 0')
sns.distplot(t1[features].mean(axis=1),color="blue", kde=True,bins=120, label='target = 1')
plt.legend(); plt.show()

続いて列毎
plt.figure(figsize=(16,6))
plt.title("Distribution of mean values per column in the train set")
sns.distplot(t0[features].mean(axis=0),color="green", kde=True,bins=120, label='target = 0')
sns.distplot(t1[features].mean(axis=0),color="darkblue", kde=True,bins=120, label='target = 1')
plt.legend(); plt.show()

特徴量の相関関係
特徴量同士で相関関係の確認をする
correlations = train_df[features].corr().abs().unstack().sort_values(kind="quicksort").reset_index()
correlations = correlations[correlations['level_0'] != correlations['level_1']]
correlations.head(10)
こちらは相関の低いものTOP10correlations.tail(10)

続いて、相関の高いものTOP10
correlations.tail(10)

みてわかる通り、特徴量同士の相関係数はかなり小さいことがわかる。
重複している値の確認
まずはtrainデータ
features = train_df.columns.values[2:202]
unique_max_train = []
unique_max_test = []
for feature in features:
    values = train_df[feature].value_counts()
    unique_max_train.append([feature, values.max(), values.idxmax()])
    values = test_df[feature].value_counts()
    unique_max_test.append([feature, values.max(), values.idxmax()])

np.transpose((pd.DataFrame(unique_max_train, columns=['Feature', 'Max duplicates', 'Value'])).\
            sort_values(by = 'Max duplicates', ascending=False).head(15))

続いてtestデータ
np.transpose((pd.DataFrame(unique_max_test, columns=['Feature', 'Max duplicates', 'Value'])).\
            sort_values(by = 'Max duplicates', ascending=False).head(15))

trainデータとtestデータの同じ列で、近い値の重複データがあることがわかった。
これはのちのち使えるかもしれないとのこと。
以上で、データ分析、探索までを行いました。
続いて、こちらで特徴量エンジニアリング、モデル作成・評価〜サブミッションまでを行います。