pythonで適当なクラスタを持つサンプルデータを作る
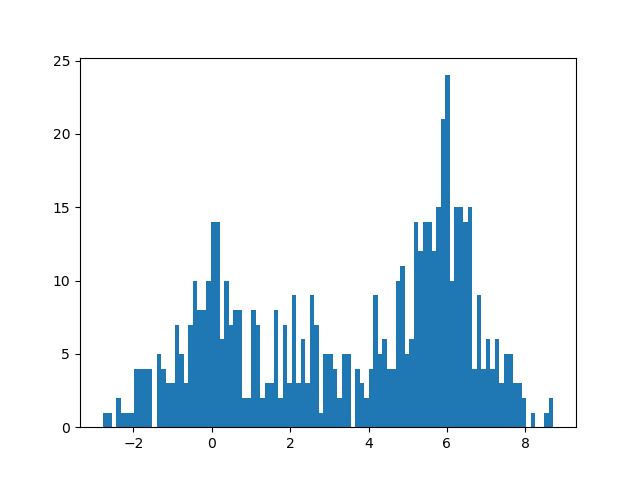
1次元の適当なサンプルを作る
こんな感じの分布のサンプルを作ります
ソースです
import matplotlib.pyplot as plt
import random
import sys

def createDistribution(counter):
    samples = []
    for cnt in counter:
        sample = []
        for i in range(cnt):
            sample.append(random.gauss(0,1))
        samples.append(sample)

    y = []
    for i in range(len(counter)):
        for j in range(len(samples[i])):
            y.append(samples[i][j] + i * 3)
    return y

def main():
    # サンプル数を指定、配列数=クラスタ数と解釈されます
    x = createDistribution([200, 100, 300]);
    plt.hist(x, bins=100)
    plt.savefig("plot1.png");

if __name__ == "__main__":
    main()
# python distribution1.py
y.append(samples[i][j] + i * 3)
i * 3 は3σ分の距離だけクラスタ中心を離しています
2次元の適当なサンプルを作る
こんな感じの分布のサンプルを作ります
ソースです
import matplotlib.pyplot as plt
import random
import sys

def createDistribution(counter):
    xx, yy = [], []
    for cnt in counter:
        ix, iy = [], []
        for i in range(cnt):
            ix.append(random.gauss(0,1))
            iy.append(random.gauss(0,1))
        xx.append(ix)
        yy.append(iy)

    x, y = [], []
    for i in range(len(counter)):
        for j in range(len(xx[i])):
            x.append(xx[i][j] + i * 3)
            y.append(yy[i][j] + i * 3)
    return x, y

def main():
    # サンプル数を指定、配列数=クラスタ数と解釈されます
    x, y = createDistribution([200, 100, 300]);
    plt.scatter(x, y)
    plt.savefig("plot2.png");

if __name__ == "__main__":
    main()
# python distribution2.py
身長体重のサンプルデータを作ってみる
正規分布乱数を利用して身長体重のサンプルデータを作ってみます
こんな感じのデータを作ります
| 身長 | 体重 |
|---|---|
| 175.481225 | 68.018599 |
| 152.675035 | 58.921772 |
| 174.513797 | 64.603158 |
| 170.562922 | 76.858922 |
| 180.125424 | 93.762856 |
| 177.360964 | 63.895156 |
| 173.432610 | 52.541947 |
| 168.964758 | 71.661168 |
| 175.044804 | 93.379319 |
平均身長はこちらを参考にして20歳の平均身長を使用しました
https://www.e-stat.go.jp/dbview?sid=0003224177
身長別体重の平均と分散はこちらを参考にして適当に決めました
https://www.kumachu.gr.jp/department/other/nutrition/kg.php
ソースです
import io
import numpy as np
import random
import sys

# https://www.e-stat.go.jp/dbview?sid=0003224177
# https://www.kumachu.gr.jp/department/other/nutrition/kg.php
# 身長, 体重, やせ, 肥満
physical_params = [
    [130,37.2,31.3,42.3],
    [131,37.8,31.7,42.9],
    [132,38.3,32.2,43.6],
    [133,38.9,32.7,44.2],
    [134,39.5,33.2,44.9],
    [135,40.1,33.7,45.6],
    [136,40.7,34.2,46.2],
    [137,41.3,34.7,46.9],
    [138,41.9,35.2,47.6],
    [139,42.5,35.7,48.3],
    [140,43.1,36.3,49],
    [141,43.7,36.8,49.7],
    [142,44.4,37.3,50.4],
    [143,45,37.8,51.1],
    [144,45.6,38.4,51.8],
    [145,46.3,38.9,52.6],
    [146,46.9,39.4,53.3],
    [147,47.5,40,54],
    [148,48.2,40.5,54.8],
    [149,48.8,41.1,55.5],
    [150,49.5,41.6,56.3],
    [151,50.2,42.2,57],
    [152,50.8,42.7,57.8],
    [153,51.5,43.3,58.5],
    [154,52.2,43.9,59.3],
    [155,52.9,44.4,60.1],
    [156,53.5,45,60.8],
    [157,54.2,45.6,61.6],
    [158,54.9,46.2,62.4],
    [159,55.6,46.8,63.2],
    [160,56.3,47.4,64],
    [161,57,48,64.8],
    [162,57.7,48.6,65.6],
    [163,58.5,49.2,66.4],
    [164,59.2,49.8,67.2],
    [165,59.9,50.4,68.1],
    [166,60.6,51,68.9],
    [167,61.4,51.6,69.7],
    [168,62.1,52.2,70.6],
    [169,62.8,52.8,71.4],
    [170,63.6,53.5,72.3],
    [171,64.3,54.1,73.1],
    [172,65.1,54.7,74],
    [173,65.8,55.4,74.8],
    [174,66.6,56,75.7],
    [175,67.4,56.7,76.6],
    [176,68.1,57.3,77.4],
    [177,68.9,58,78.3],
    [178,69.7,58.6,79.2],
    [179,70.5,59.3,80.1],
    [180,71.3,59.9,81],
    [181,72.1,60.6,81.9],
    [182,72.9,61.3,82.8],
    [183,73.7,62,83.7],
    [184,74.5,62.6,84.6],
    [185,75.3,63.3,85.6],
    [186,76.1,64,86.5],
    [187,76.9,64.7,87.4],
    [188,77.8,65.4,88.4],
    [189,78.6,66.1,89.3],
]

def near_index(x, n):
    a = (x - n) ** 2
    idx = np.argmin(a)
    return idx

def main():
    params = np.array(physical_params).astype(float)
    params_len = len(params)
    height = params[:,0]
    weight = params[:,1]
    skinny = params[:,2]
    fatness = params[:,3]

    # base params # 20歳の身長平均、偏差を使用する
    height_avr = 169.1
    height_var = 6.8
    sample_count = 100

    samples = []
    for i in range(sample_count):
        h = random.gauss(height_avr, height_var)
        idx = near_index(height, h)
        weight_avr = weight[idx]
        weight_var = abs(fatness[idx] - skinny[idx]) / 2
        w = random.gauss(weight_avr, weight_var)
        samples.append([h, w])
    s = io.StringIO()
    np.savetxt(s, samples, fmt="%f", delimiter="\t")
    print(s.getvalue())

if __name__ == "__main__":
    main()
# python physical_feature.py
使い道とか
売上とか在庫とかなんでもいいのでダミーデータが件数欲しい時に一応それっぽい分散をしていてほしいとか、そういう時に役に立つかもしれません
後は機械学習系のアルゴリズムの試験やる時にあからさまなクラスターを使用して性能チェックするとかなんとか、そういう時にも役に立つかもしれません
以上です

