今回は、カテゴリが設定されたデータを複数のグラフにして出します。
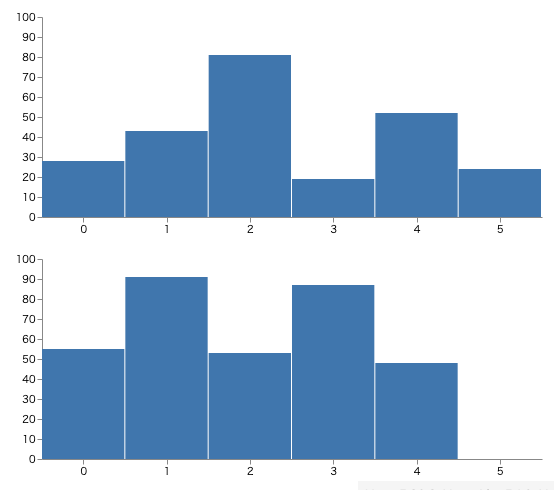
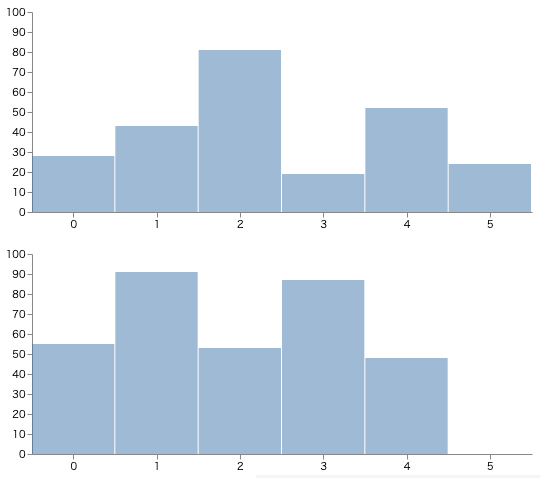
完成形は以下のような感じに上下に二つのグラフが並びます。
利用データ
x,y,cからなるデータです。最終的にcごとのグラフを作成します。
[
{"x":0,"y":28,"c":0},{"x":0,"y":55,"c":1},
{"x":1,"y":43,"c":0},{"x":1,"y":91,"c":1},
{"x":2,"y":81,"c":0},{"x":2,"y":53,"c":1},
{"x":3,"y":19,"c":0},{"x":3,"y":87,"c":1},
{"x":4,"y":52,"c":0},{"x":4,"y":48,"c":1},
{"x":5,"y":24,"c":0}
]
重ねて表示
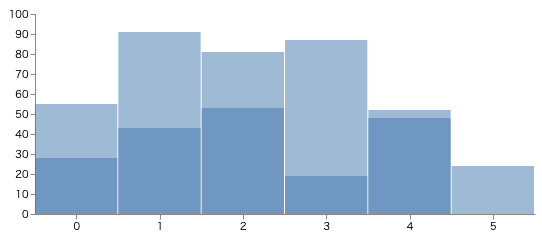
一旦、重ねて表示します。通常の棒グラフ表示ですので、ここを参考してください。
グラフ表示部のグルーピング
marksに type="group" を導入します。
table データの c でグルーピングし、table_facet という名前をつけています。入れ子になっている 'marks'が、グルーピングされたデータ群に対して、繰り返し実行されます。
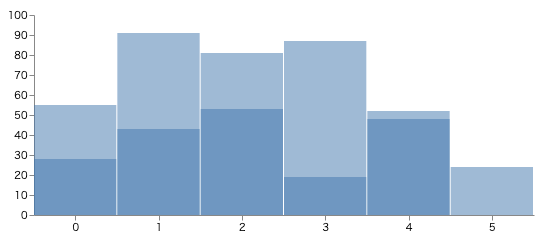
グラフの見た目は変わっていないですが、c=0,c=1で2回、同じ場所に棒グラフ描画をしているイメージです。
  "marks": [
    {
      "type": "group",
      "from": {
        "facet": {
          "name": "table_facet",
          "data": "table",
          "groupby": ["c"]
        }
      },
      "marks":[
        {
          "type": "rect",
          "from": {
            "data": "table_facet"
          },
          "encode": {
// 先ほどと同じ棒グラフの表示を記載
グラフの分離(Layoutの導入)
レイアウトを設定するために、 layout を導入します。
columns=1 のため、縦一列に並ぶようになります。
  "layout": {
    "padding": 20,
    "columns": 1
  },
軸の描画
type="group" に axes の設定を移動し、widthとheight を設定する encode も追加します。
これで、データを分類し複数のグラフで表示することができました。
  "marks": [
    {
      "type": "group",
      "from": {
        "facet": {
          "name": "table_facet",
          "data": "table",
          "groupby": ["c"]
        }
      },
      "encode": {
        "update": {
          "width": {"signal": "width"},
          "height": {"signal": "height"}
        }
      },
      "axes": [
        {
          "orient": "bottom",
          "scale": "xscale"
        },
        {
          "orient": "left",
          "scale": "yscale"
        }
      ],
(おまけ)軸をあわせる必要がない時
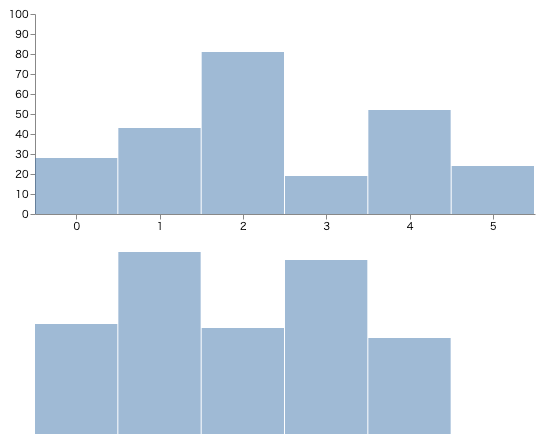
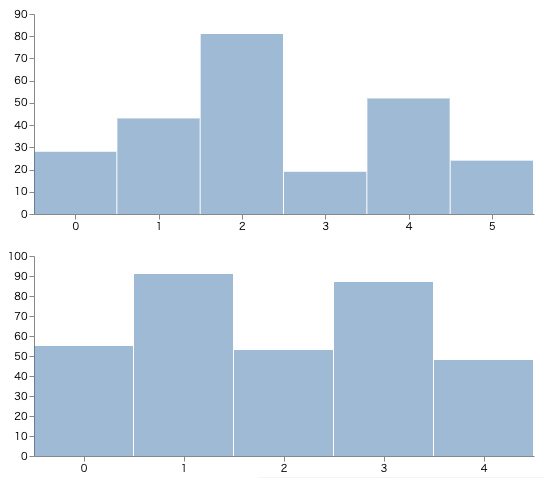
axes と同様に type="group" に scales を移動し、参照先のデータを table から table_facet に切り替えると、x軸、y軸のスケールがそれぞれのデータセットに応じた値になります。
      "scales": [
        {
          "name": "xscale",
          "type": "band",
          "range": "width",
          "domain": {
            "data": "table_facet",
            "field": "x"
          }
        },
        {
          "name": "yscale",
          "type": "linear",
          "range": "height",
          "nice": true,
          "zero": true,
          "domain": {
            "data": "table_facet",
            "field": "y"
          }
        }
      ],
