以前に Jupyter Lab にVegaでグラフを表示す を記載しましたが、その時はVega-Altairを使っていました。しかし、Altairではvega-lite specを利用したグラフは描画できるが、Vega specは利用できないため、複雑なグラフを描画できないとう課題がありました。
今回は、Altairを使わずにJupyter Lab上でVega specのグラフを表示する方法です。
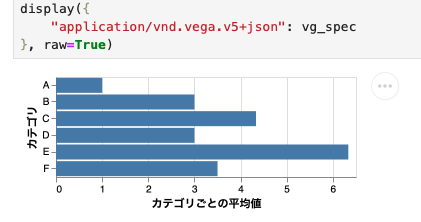
IPython.display モジュールに、MIME type application/vnd.vega.v5+json を指定し、Vega specを渡すことでVegaグラフを描画できます。
import json
from IPython.display import display

vg_spec={
#   省略
}

display({
    "application/vnd.vega.v5+json": vg_spec
}, raw=True)
vg_spec
vg_spec={
  "$schema": "https://vega.github.io/schema/vega/v5.json",
  "background": "white",
  "padding": 5,
  "width": 300,
  "height": 100,
  "style": "cell",
  "data": [
    {
      "name": "table",
      "values": [
        {"a": "A", "b": 1},
        {"a": "B", "b": 3},
        {"a": "C", "b": 2},
        {"a": "C", "b": 7},
        {"a": "C", "b": 4},
        {"a": "D", "b": 1},
        {"a": "D", "b": 2},
        {"a": "D", "b": 6},
        {"a": "E", "b": 8},
        {"a": "E", "b": 4},
        {"a": "E", "b": 7},
        {"a": "F", "b": 2},
        {"a": "F", "b": 5}
       ],
      "transform": [
        {
          "type": "aggregate",
          "groupby": ["a"],
          "ops": ["average"],
          "fields": ["b"],
          "as": ["average_b"]
        }
      ]
    }
  ],
  "marks": [
    {
      "name": "marks",
      "type": "rect",
      "style": ["bar"],
      "from": {"data": "table"},
      "encode": {
        "update": {

          "x": {"scale": "x", "field": "average_b"},
          "x2": {"scale": "x", "value": 0},
          "y": {"scale": "y", "field": "a"},
          "height": {"signal": "max(0.25, bandwidth('y'))"}
        }
      }
    }
  ],
  "scales": [
    {
      "name": "x",
      "type": "linear",
      "domain": {"data": "table", "field": "average_b"},
      "range": "width",
      "nice": True,
      "zero": True
    },
    {
      "name": "y",
      "type": "band",
      "domain": {"data": "table", "field": "a", "sort": True},
      "range": "height",
      "paddingInner": 0.1,
      "paddingOuter": 0.05
    }
  ],
  "axes": [
    {
      "scale": "x",
      "orient": "bottom",
      "grid": True,
      "title": "カテゴリごとの平均値",
      "labelFlush": True,
      "labelOverlap": True,
      "tickCount": {"signal": "ceil(width/40)"},
      "zindex": 0
    },
    {
      "scale": "y",
      "orient": "left",
      "grid": False,
      "title": "カテゴリ",
      "zindex": 0
    }
  ]
}
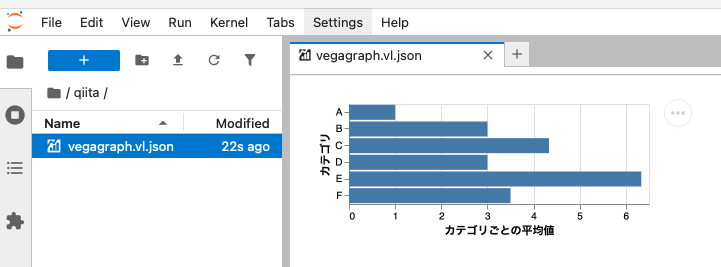
ちなみに、xxs.vl.json というファイル名でVega specファイルを保存し開き直すと、特に何もせず Vega グラフが表示されます。

