Prometheusについて
細かいインストール方法等は他を見てね!! ![]()
- Prometheusのインストール方法(公式)
- Prometheusのインストール方法(個人によるもの)
他にもググるとたくさん出てくるので、詳しくは他のブログを参考にしてください
公式のドキュメントのほうがより正確な情報なので、一度は目を通しましょう
今回の構成
やること
- 概要
- Prometheus on Docker Compose
- 理由
- 記述が容易なこと
- 状態が(比較的に)分かりやすいこと
- Dockerコンテナを使うことで、ホストサーバの環境をなるべく汚さずに検証が出来ること
ソース
- 階層構造
$ tree -a
.
├── docker-compose.yml
├── readme.md
└── svr
    ├── etc
    │   └── prometheus
    │       └── prometheus.yml
    └── prometheus
        └── .gitignore
- 各種ファイルの内容
$ cat docker-compose.yml
version: '3.3'

services:
  prometheus:
    image: prom/prometheus:v2.6.0
    container_name: prometheus_on_dockercompose
    ports:
      - "9090:9090"
    volumes:
      - ./svr/etc/prometheus/prometheus.yml:/etc/prometheus/prometheus.yml
      - ./svr/prometheus:/prometheus
    restart: always
$ cat svr/etc/prometheus/prometheus.yml
# my global config
global:
  scrape_interval:     15s # Set the scrape interval to every 15 seconds. Default is every 1 minute.
  evaluation_interval: 15s # Evaluate rules every 15 seconds. The default is every 1 minute.
  # scrape_timeout is set to the global default (10s).

# Alertmanager configuration
alerting:
  alertmanagers:
  - static_configs:
    - targets:
      # - alertmanager:9093

# Load rules once and periodically evaluate them according to the global 'evaluation_interval'.
rule_files:
  # - "first_rules.yml"
  # - "second_rules.yml"

# A scrape configuration containing exactly one endpoint to scrape:
# Here it's Prometheus itself.
scrape_configs:
  # The job name is added as a label `job=<job_name>` to any timeseries scraped from this config.
  - job_name: 'prometheus'

    # metrics_path defaults to '/metrics'
    # scheme defaults to 'http'.

    static_configs:
    - targets: ['localhost:9090']
$ cat svr/prometheus/.gitignore
*
!.gitignore
上記は GitHubにて公開しています
prometheus-on-dockercompose/part01
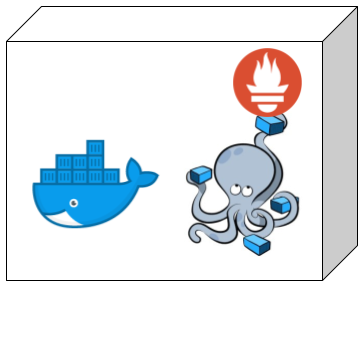
今回の構成のイメージ図
使用方法
起動方法
- Docker Composeの起動コマンド
docker-compose up -d
- Docker Composeの状態確認コマンド
docker-compose ps
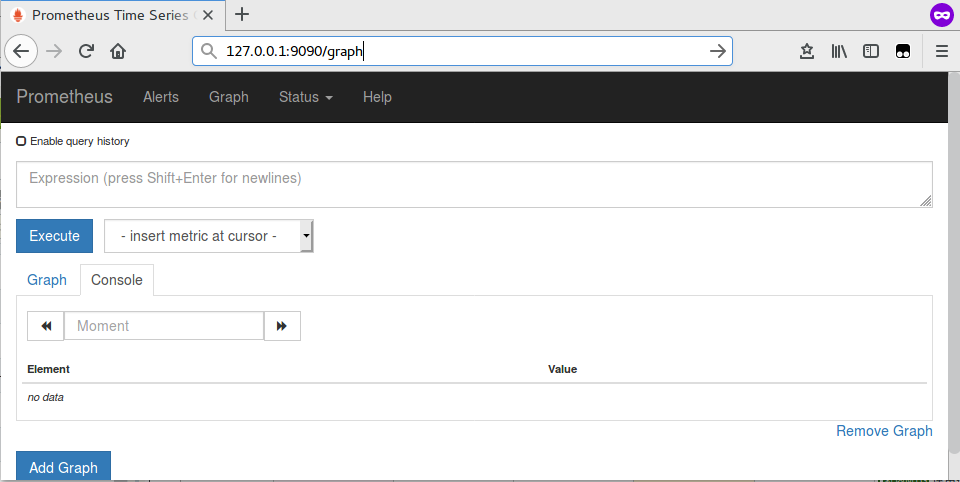
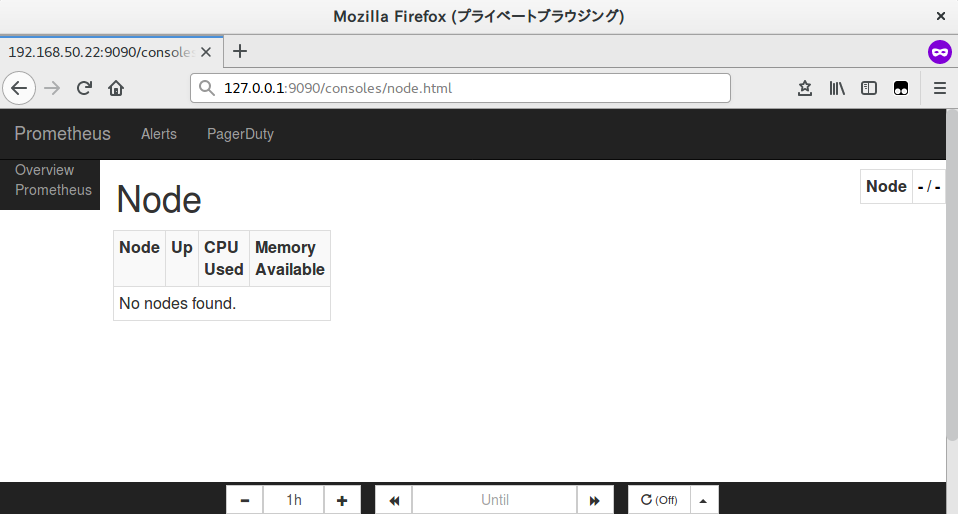
ブラウザで確認する
Docker Composeにて起動したPrometheusが、以下のURLで立ち上がっていると思います
停止・削除方法
- Docker Composeの停止コマンド
docker-compose stop
- Docker Composeの削除コマンド
docker-compose rm (-y)
まとめ
- Docker Composeを用いて、Prometheusを起動しました
- 次回から、被監視サーバを追加していきます(年始くらいに投稿予定です)