データを見る事から離れて少し時間があいてしまったので、データを見る機会を意図的に作るためにも、Splunkと、Splunk Machine Learning Toolkitをいじりながらデータをいじるということをやってみます。
扱うデータを何にするか
目的が、”久々にデータと戯れる”というレベルなので、(おなじみの)以下のKaggleのレンタル自転車データに天気情報とおやすみ情報を突合させたを使ってみます。
https://www.kaggle.com/c/bike-sharing-demand/
ワシントンDCのレンタル自転車サービスのレンタル数を天気、気温、その他の状態から予測してみましょう、というやつです。
Acknowledgements
Kaggle is hosting this competition for the machine learning community to use for fun and practice. This dataset was provided by Hadi Fanaee Tork using data from Capital Bikeshare. We also thank the UCI machine learning repository for hosting the dataset. If you use the problem in publication, please cite:
Fanaee-T, Hadi, and Gama, Joao, Event labeling combining ensemble detectors and background knowledge, Progress in Artificial Intelligence (2013): pp. 1-15, Springer Berlin Heidelberg.
もろもろ読んでいただいて、Dataタブから早速3つのcsv (train.csv, test.csv, sampleSubmission.csv)をダウンロードします。
データをみてみる。
データの概要は以下のような感じ。
datetime - hourly date + timestamp
season -  1 = spring, 2 = summer, 3 = fall, 4 = winter
holiday - whether the day is considered a holiday
workingday - whether the day is neither a weekend nor holiday
weather - 1: Clear, Few clouds, Partly cloudy, Partly cloudy
2: Mist + Cloudy, Mist + Broken clouds, Mist + Few clouds, Mist
3: Light Snow, Light Rain + Thunderstorm + Scattered clouds, Light Rain + Scattered clouds
4: Heavy Rain + Ice Pallets + Thunderstorm + Mist, Snow + Fog
temp - temperature in Celsius
atemp - "feels like" temperature in Celsius
humidity - relative humidity
windspeed - wind speed
casual - number of non-registered user rentals initiated
registered - number of registered user rentals initiated
count - number of total rentals
で、train.csvはこんな。
$ head -3 train.csv
datetime,season,holiday,workingday,weather,temp,atemp,humidity,windspeed,casual,registered,count
2011-01-01 00:00:00,1,0,0,1,9.84,14.395,81,0,3,13,16
2011-01-01 01:00:00,1,0,0,1,9.02,13.635,80,0,8,32,40
で、test.csvはこんな。
$ head -3 test.csv
datetime,season,holiday,workingday,weather,temp,atemp,humidity,windspeed
2011-01-20 00:00:00,1,0,1,1,10.66,11.365,56,26.0027
2011-01-20 01:00:00,1,0,1,1,10.66,13.635,56,0
で、sampleSubmission.csvはこんな。
$ head -3 sampleSubmission.csv
datetime,count
2011-01-20 00:00:00,0
2011-01-20 01:00:00,0
train.csvの情報をつかって、test.csvのそれぞれの時間帯のレンタル数を予想し、最後にsampleSubmission.csvのフォーマットにして出力してくださいな、という事ですな。
*今回は戯れるだけなので、小難しい話は抜きにしてとにかく進めます。
では、早速必要なソフトウェアをダウンロードして準備します。
まずはセットアップ
今回使うのはこちら:
- Splunk Enterprise のmacos版 (https://www.splunk.com/en_us/download/splunk-enterprise.html#tabs/macos)
- Python for Scientific Computing for Mac (https://splunkbase.splunk.com/app/2881/)
- Machine Learning Toolkit (https://splunkbase.splunk.com/app/2890/)
こちら3つをダウンロードして、以下の用な感じでインストールしていく。
$ ls
kaggle-bike-sharing-demand			splunk-8.0.1-6db836e2fb9e-darwin-64.tgz
python-for-scientific-computing-for-mac_200.tgz	splunk-machine-learning-toolkit_500.tgz
まずは、Splunk自体を展開&起動
$ tar xf splunk-8.0.1-6db836e2fb9e-darwin-64.tgz
$ ./splunk/bin/splunk start --accept-license

This appears to be your first time running this version of Splunk.
...
Please enter an administrator username: admin
Password must contain at least:
   * 8 total printable ASCII character(s).
Please enter a new password:
Please confirm new password:

...
Waiting for web server at http://127.0.0.1:8000 to be available... Done


If you get stuck, we're here to help.
Look for answers here: http://docs.splunk.com

The Splunk web interface is at http://your-ip:8000
これで、Splunkの起動まで終了。ブラウザで8000番ポートにアクセスするとログイン画面がでてきて、WebUIから各種設定できますが、今回はこのまますすめます。(ちなみに、adminロールのユーザー名はadminでなくても構いませんし、adminでないほうが良い気がします)
で、Machine Learning Toolkitを使うために必要なモジュール一式がはいったものをインストールします。
$ ./splunk/bin/splunk install app ./python-for-scientific-computing-for-mac_200.tgz
Your session is invalid.  Please login.
Splunk username: admin
Password:
App '/Users/mhyugaji/Desktop/CapitalBikeshare-Tripdata/python-for-scientific-computing-for-mac_200.tgz' installed
You need to restart the Splunk Server (splunkd) for your changes to take effect.
再起動しなさい、と言われてますが、すすみます。
で、Machine Learning Toolkit自体も忘れずにインストールします。
$ ./splunk/bin/splunk install app ./splunk-machine-learning-toolkit_500.tgz
App '/Users/mhyugaji/Desktop/CapitalBikeshare-Tripdata/splunk-machine-learning-toolkit_500.tgz' installed
You need to restart the Splunk Server (splunkd) for your changes to take effect.
再起動しなさい、と言われてますが、すすみます。
で、Splunkではappという単位で任意にUIやら設定ファイルやらをまとめることができますが、今回は折角なのでkaggle-bike-sharing-demandという名前でappをつくって、設定等をまとめていきます。
$ ./splunk/bin/splunk create app kaggle-bike-sharing-demand
App 'kaggle-bike-sharing-demand' is created.
再起動しなさい、と言われてますが、すすみます。
上のappの作成まで終了した時点で、以下のようなapp専用のディレクトリが作成されています。
$ tree splunk/etc/apps/kaggle-bike-sharing-demand/
splunk/etc/apps/kaggle-bike-sharing-demand/
├── bin
│   └── README
├── default
│   ├── app.conf
│   └── data
│       └── ui
│           ├── nav
│           │   └── default.xml
│           └── views
│               └── README
└── metadata
    └── default.meta
まだ再起動しません。
データを入れるためのindexを用意します。
名前はbikeにします。
$ ./splunk/bin/splunk add index bike -app kaggle-bike-sharing-demand
Index "bike" added.
$ tree splunk/etc/apps/kaggle-bike-sharing-demand/
splunk/etc/apps/kaggle-bike-sharing-demand/
├── bin
│   └── README
├── default
│   ├── app.conf
│   └── data
│       └── ui
│           ├── nav
│           │   └── default.xml
│           └── views
│               └── README
├── local
│   └── indexes.conf
└── metadata
    ├── default.meta
    └── local.meta
そろそろSplunkの再起動を忘れそうなので、やっておきます。
$ ./splunk/bin/splunk restart
Stopping splunkd...
ここまでやったことは:
- Kaggleの各種csvをダウンロード
- SplunkとMachine Learning Toolkit、Machine Learning Toolkit用のモジュールのインストール
- kaggle-bike-sharing-demand appの作成
- データを入れるための
bikeindexの作成
データを見てみる
再起動が終わったら、早速ブラウザから8000番ポートへアクセスしてみます。
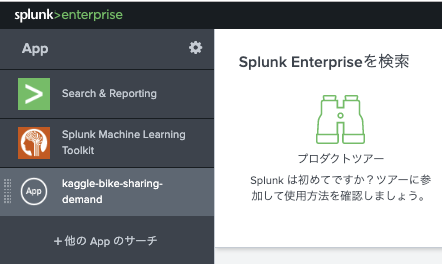
ログイン後は早速先程のステップで作成したAppを選択して使っていきます。
まだデータをインデックスしてないので、早速取り込んでいきます。
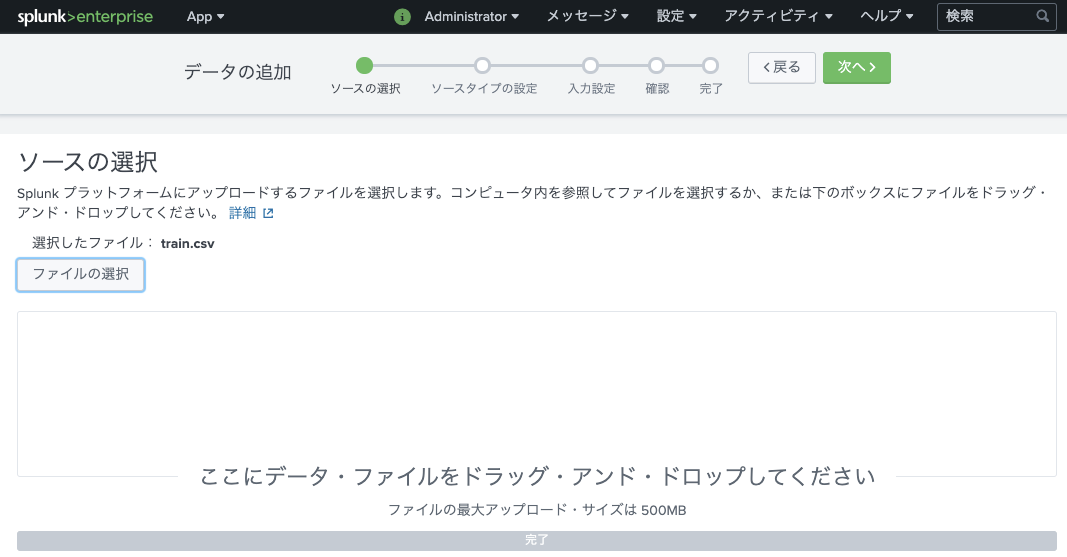
設定→でデータの追加→アップロードとすすんで、train.csvをアップロードします。
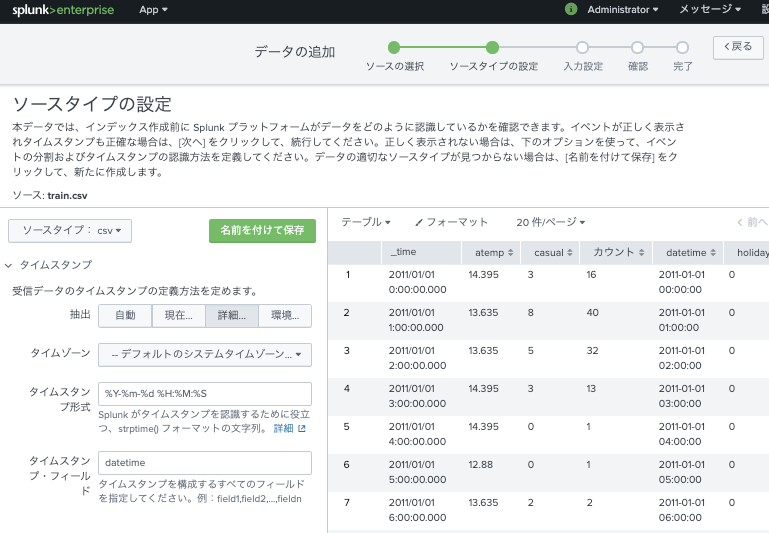
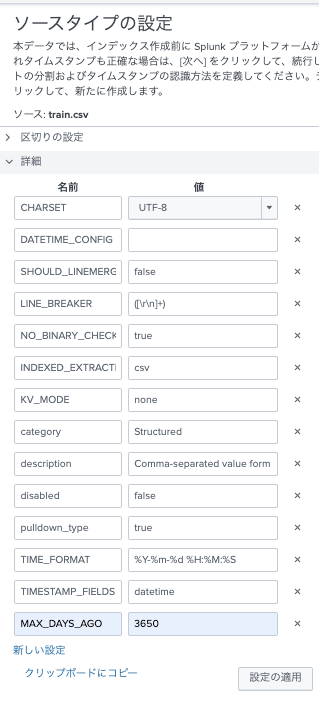
各種フィールドの認識を正しく行うために、ソースタイプの設定をおこないます。
ここのポイントは
- 基本的にcsv
- タイムスタンプはdatetimeフィールド
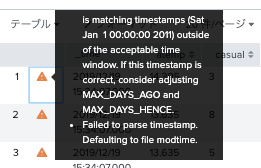
- Splunkでは、デフォルトで6年より古いデータはとりこんでも消される。(ので調整が必要)
- Splunkでは、現在時刻と比較して古すぎるデータは不正と判断される。(ので調整が必要)
上を意識して以下のように設定します。
・タイムスタンプ形式は、%Y-%m-%d %H:%M:%S
・タイムスタンプフィールドは datetime
・MAX_DAYS_AGOを10年くらいに 3650
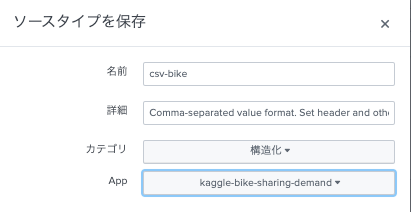
ソースタイプ名をcsv-bikeとして保存しました。
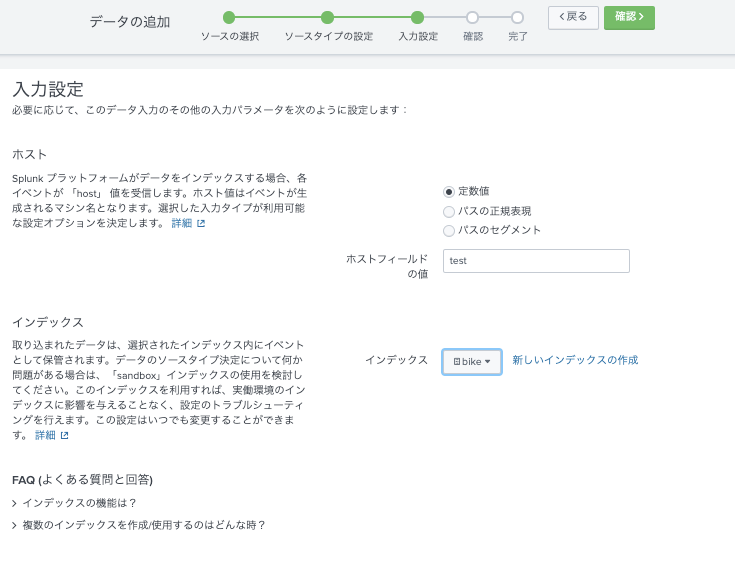
Indexにbikeを指定。
確認
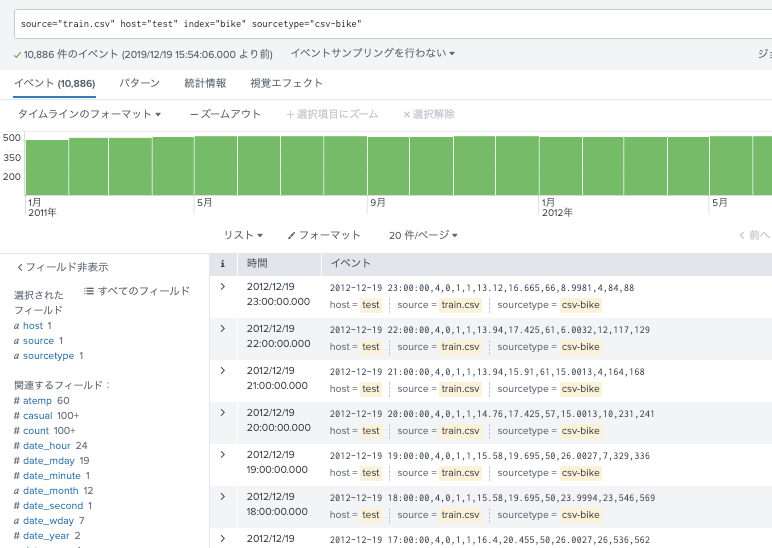
進んで、検索窓に戻ると、以下のようにみえているはず。
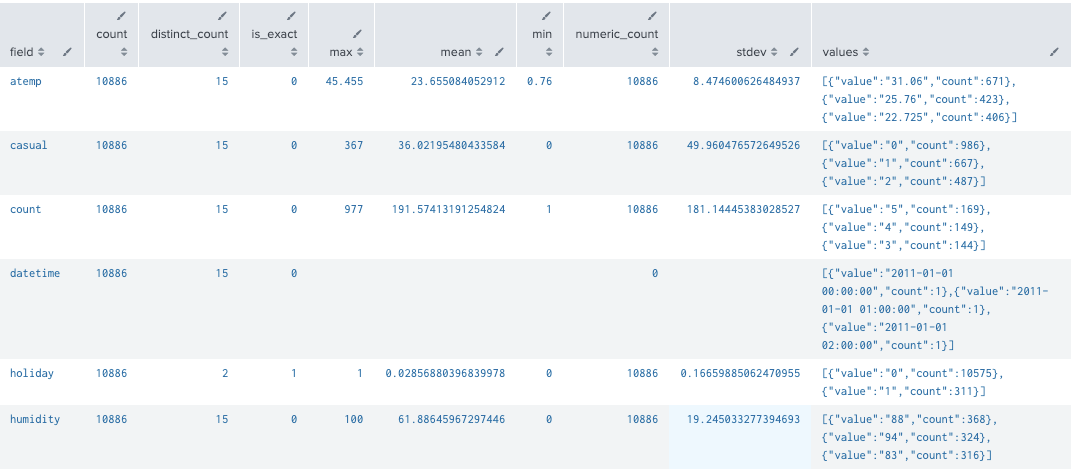
各フィールドの中身をみてみる。
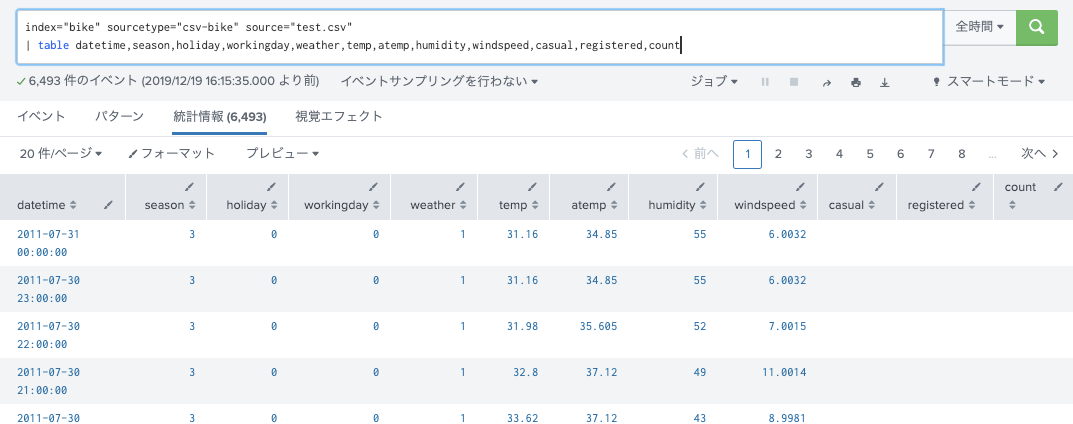
早速、取り込んだtrain.csvを見てみる。
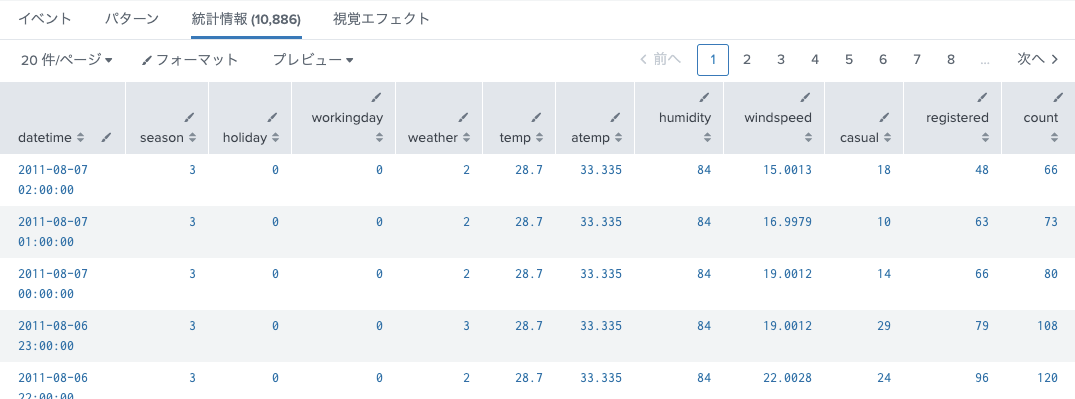
index="bike" sourcetype="csv-bike"
| table datetime,season,holiday,workingday,weather,temp,atemp,humidity,windspeed,casual,registered,count
index="bike" sourcetype="csv-bike"
| table datetime,season,holiday,workingday,weather,temp,atemp,humidity,windspeed,casual,registered,count
| fieldsummary maxvals=3
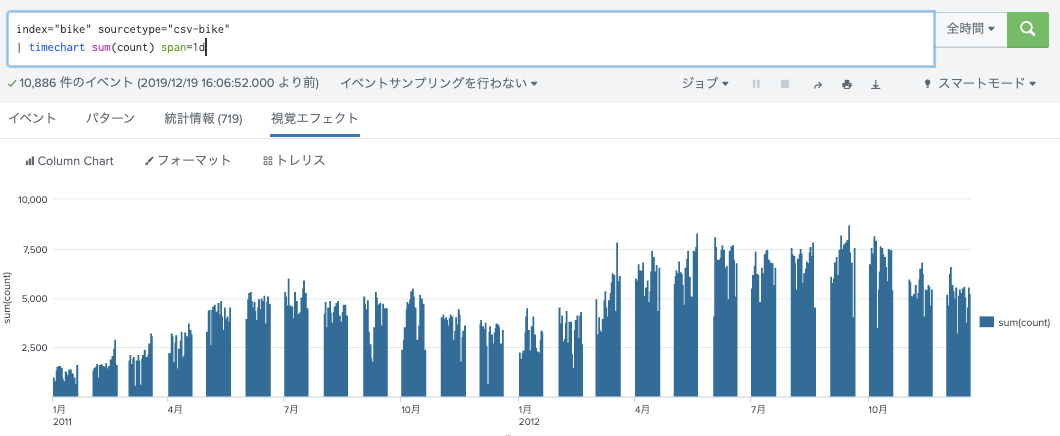
index="bike" sourcetype="csv-bike"
| timechart sum(count) span=1d
train.csv、のデータは歯抜けになっている。(みそっ歯)
ちっとtest.csvもいれてみてみましょ。
手順は、train.csvの場合とほぼ一緒。ソースタイプの選択をcsv-bikeにするのを忘れずに。
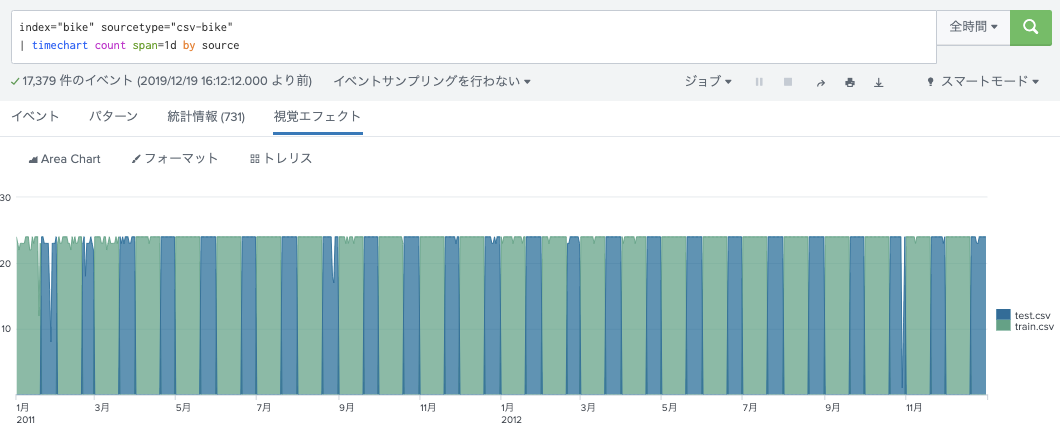
index="bike" sourcetype="csv-bike"
| timechart count span=1d by source
train.csvには含まれていない時間がtest.csvにはあるけど、レンタル数は記載されていない。
もうちっとtrain.csvを見てみる
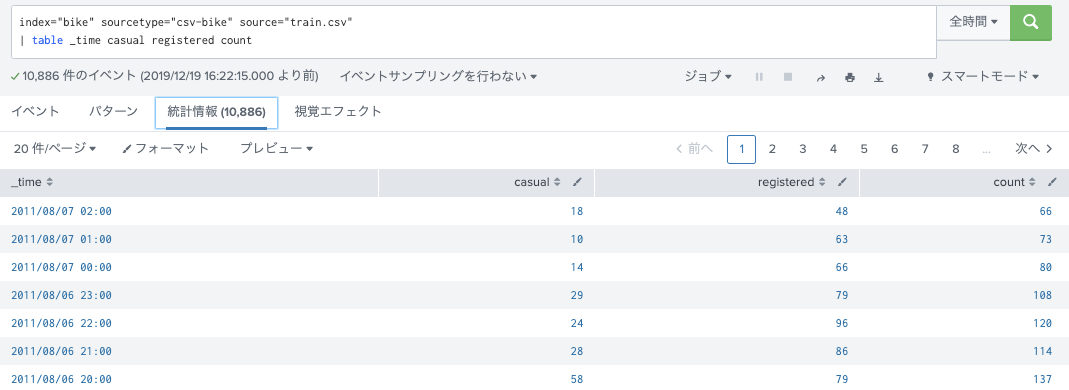
レンタル数の内訳として、どうやらサービスに登録している人と、旅行者のような都度レンタルするタイプの2種類があるみたい。フィールドは、次の3つ。
countは全体 = casual(おそらく都度かりる人) + registered (おそらく定期で登録している人)
全体の分布としては、登録しているひとのほうが多い。
index="bike" sourcetype="csv-bike" source="train.csv"
| timechart sum(casual) sum(registered)
時間帯別にみると、casualとregisterでは分布が違う。
index="bike" sourcetype="csv-bike" source="train.csv"
| stats sum(casual) as casual sum(registered) as registered by date_hour
| sort date_hour
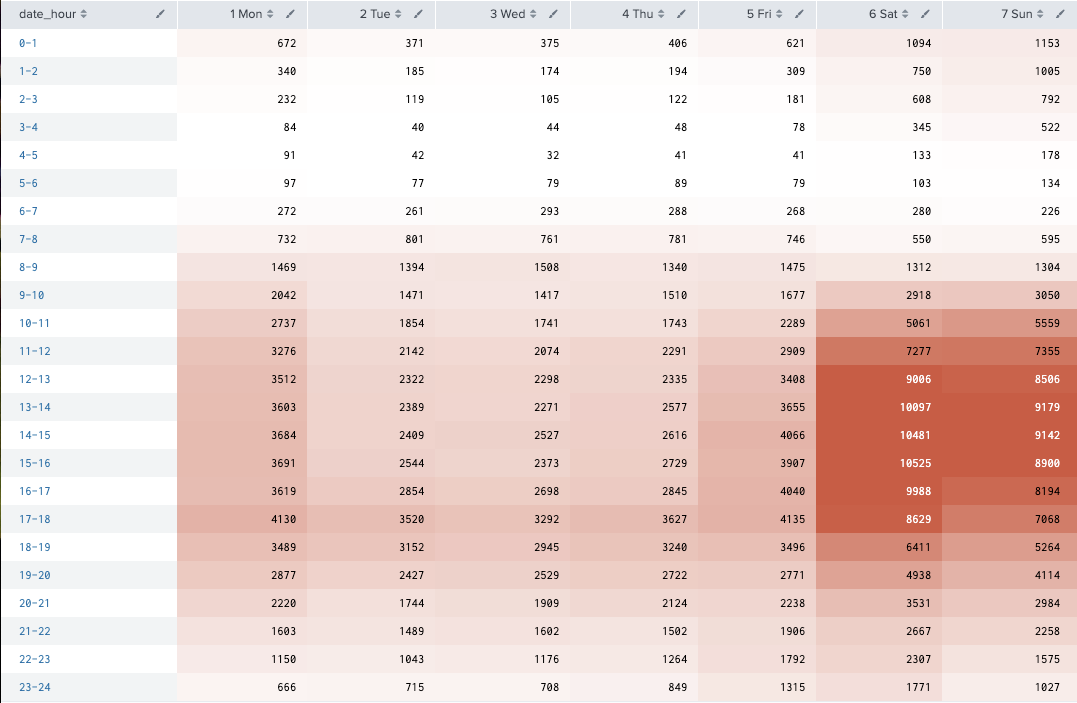
casualの曜日別、時間帯別(2時間集計)ヒートマップ
・昼間が多い
・土日が多い
index="bike" sourcetype="csv-bike" source="train.csv"
| eval date_wday_n=strftime(_time,"%u %a")
| bin date_hour span=1
| stats sum(casual) as c by date_hour date_wday_n
| xyseries date_hour date_wday_n c
| sort date_hour date_wday_n
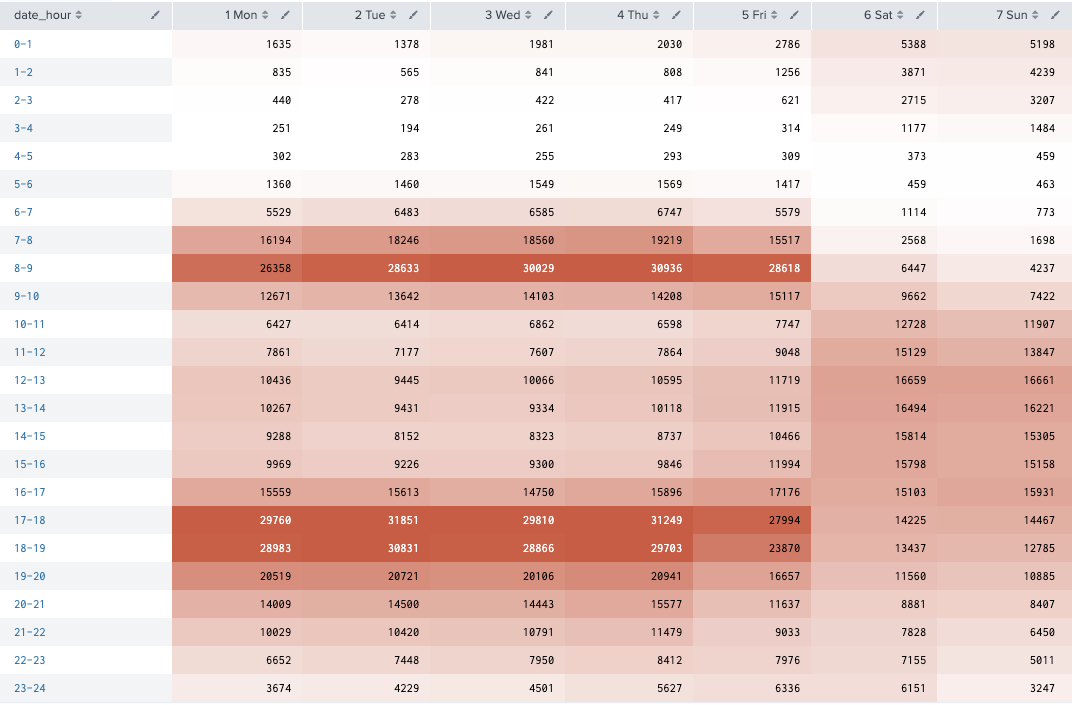
Registeredの人は通勤時間帯に利用が多い。
index="bike" sourcetype="csv-bike" source="train.csv"
| eval date_wday_n=strftime(_time,"%u %a")
| bin date_hour span=1
| stats sum(registered) as c by date_hour date_wday_n
| xyseries date_hour date_wday_n c
| sort date_hour date_wday_n
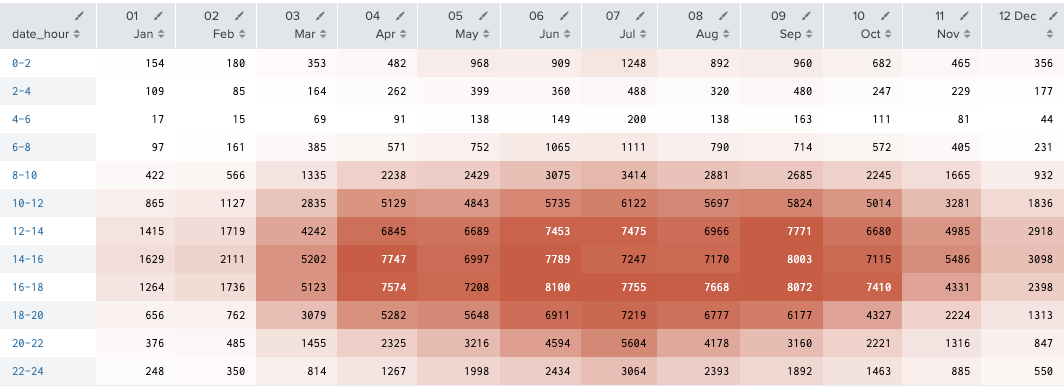
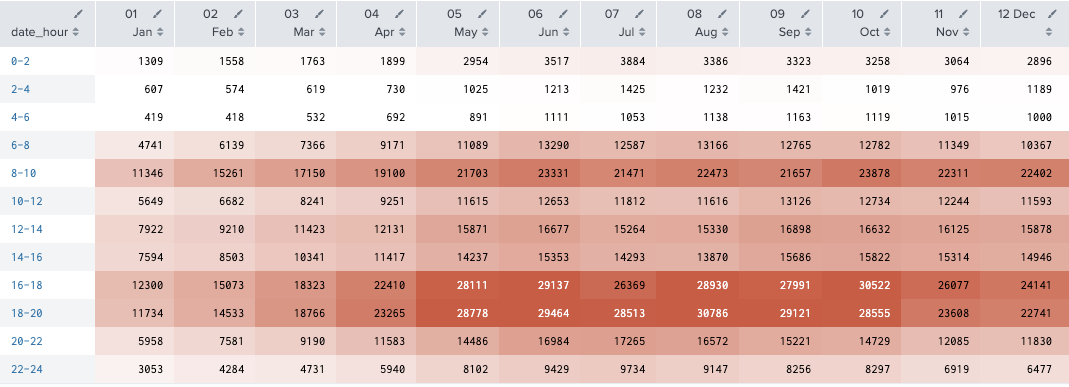
月別、時間帯別にそれぞれみてみる。
index="bike" sourcetype="csv-bike" source="train.csv"
| eval date_month_n=strftime(_time,"%m %b")
| bin date_hour span=2
| stats sum(casual) as c by date_hour date_month_n
| xyseries date_hour date_month_n c
| sort date_hour
index="bike" sourcetype="csv-bike" source="train.csv"
| eval date_month_n=strftime(_time,"%m %b")
| bin date_hour span=2
| stats sum(registered) as r by date_hour date_month_n
| xyseries date_hour date_month_n r
| sort date_hour
おそらく通勤で使ってんだろうから、registeredさん達は冬でも真夏でも使うだろうね。
casualさんたちは、チャリンコ乗って気持ちいい季節につかうのかな。それかちょっと急用があるときとか。
なので寒い冬は乗らないのかしら。
tempと体感温度のatempを見てみるのは、またのいつの日かにします。
significanceとかは特にさわりません。(汗
が、少し、各フィールド・フィーチャーのimportanceやらcoefficientやらを見てみます。
index="bike" sourcetype="csv-bike" source="train.csv"
| table season,holiday,workingday,weather,temp,atemp,humidity,windspeed,casual
| fit RandomForestRegressor casual from season,holiday,workingday,weather,temp,atemp,humidity,windspeed into model_rfr
| summary model_casual_rfr
| sort -importance
index="bike" sourcetype="csv-bike" source="train.csv"
| table season,holiday,workingday,weather,temp,atemp,humidity,windspeed,registered
| fit RandomForestRegressor registered from season,holiday,workingday,weather,temp,atemp,humidity,windspeed into model_registered_rfr
| summary model_registered_rfr
| sort -importance
index="bike" sourcetype="csv-bike" source="train.csv"
| table season,holiday,workingday,weather,temp,atemp,humidity,windspeed,casual
| fit LinearRegression casual from season,holiday,workingday,weather,temp,atemp,humidity,windspeed into model_lr_casual
| summary model_lr_casual
| fields - _intercept
| sort - coefficient
index="bike" sourcetype="csv-bike" source="train.csv"
| table season,holiday,workingday,weather,temp,atemp,humidity,windspeed,registered
| fit LinearRegression registered from season,holiday,workingday,weather,temp,atemp,humidity,windspeed into model_lr_registered
| summary model_lr_registered
| fields - _intercept
| sort - coefficient
今日は、ここまでにします。
やったことは:
- SplunkとMLTKの設定した。
- データを投入し、眺めた。
- 各特徴の関連を少し見てみた。
- casualとregisteredそれぞれに関連するフィールドの違いをみた。(気がする)
ということで、この続きはまた今度。
** 実はindexes.confのfrozenTimePeriodInSecsfrozenTimePeriodInSecsの設定しわすれてます。(再起動後にびっくりするかも...)
frozenTimePeriodInSecs =
- The number of seconds after which indexed data rolls to frozen.
- If you do not specify a 'coldToFrozenScript', data is deleted when rolled to
frozen. - NOTE: Every event in a bucket must be older than 'frozenTimePeriodInSecs'
seconds before the bucket rolls to frozen. - The highest legal value is 4294967295.
- Default: 188697600 (6 years)

