はじめに
本投稿は、Aurora PostgreSQLの監査ログをAmazon Elasticsearch Serviceに取り込んでみたという内容になっています。
利用環境
| product | version |
|---|---|
| logstash (OSS版) | 7.7.1 |
| Java (Corretto) | 11.0.8 |
| OS(EC2) | Amazon Linux2 (t3.small) |
| AMI ID | ami-03657b56516ab7912 |
| Elasticsearch | 7.7 (latest) |
| PostgreSQL | 11.6 |
| Region | us-east-2 |
| ※投稿時点における最新版を採用しています。 |
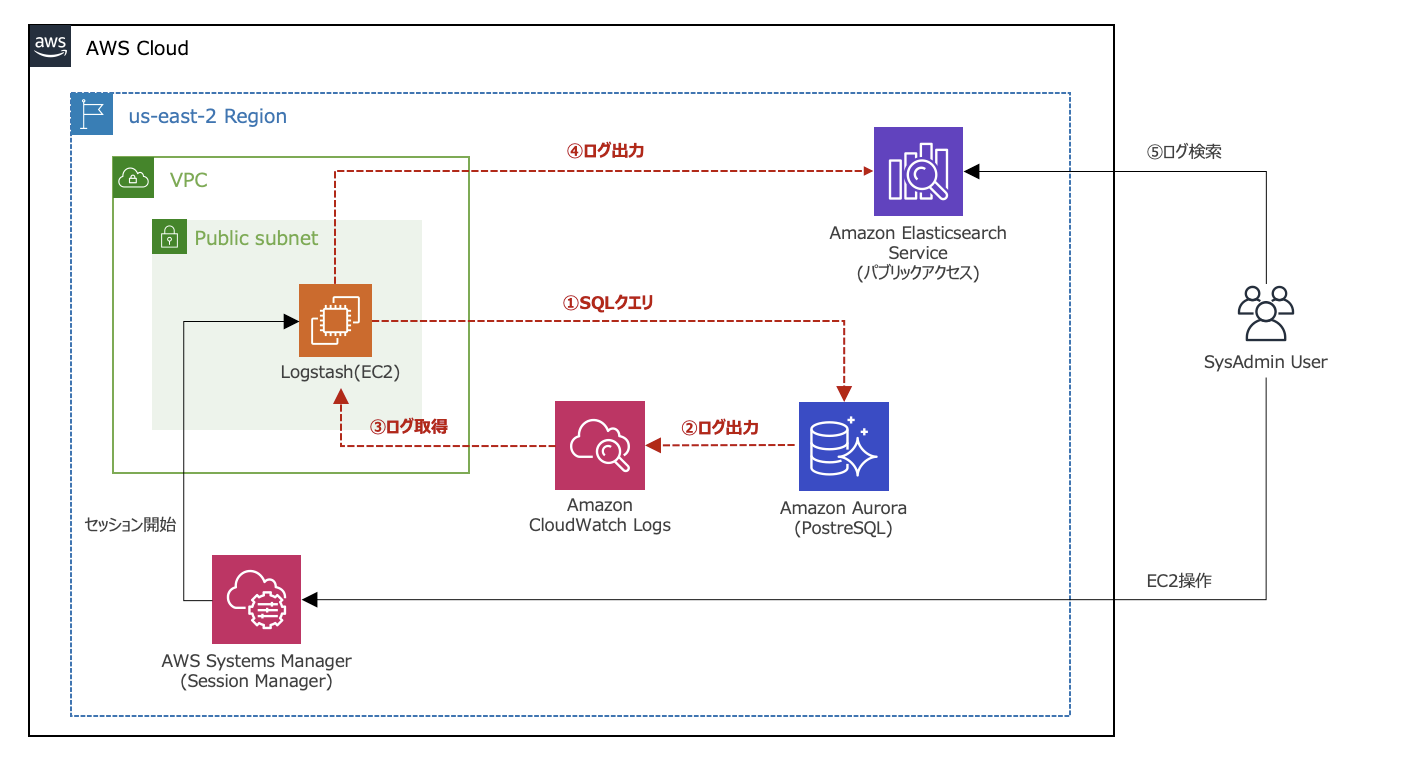
【構成図】
- CloudWatch Logsに出力したAurora PostgreSQLのログをLogstashがInputしています。
前提条件
- Aurora PostgreSQLのスロークエリログをAmazon ESに取り込んでみたで構築した環境を前提としています。
- 全てのDBコマンド処理は、Auraro PostgreSQLのマスターユーザで実行しています。
実施内容
- 監査ログ出力設定
- 監査ログの確認
- Logstashの設定
- Kibanaでの設定
1. 監査ログ出力設定
- まず、rds_pgauditという特定のデータベースロールを作成します。
- [Systems Manager] > [Session Manager]からLogstash用のEC2に接続します。
- EC2から以下のコマンド操作でDBに接続し、CREATE ROLEコマンドでrds_pgauditを作成します。
※ EC2からPostgreSQLにTCP5432で通信許可されている状態としています。
$ psql -h [Auroraのエンドポイント] -U [マスターユーザ名]
Password for user postgres: xxxxxxxxxxx(パスワード)
psql (9.2.24, server 11.6)
WARNING: psql version 9.2, server version 11.0.
         Some psql features might not work.
SSL connection (cipher: ECDHE-RSA-AES256-GCM-SHA384, bits: 256)
Type "help" for help.

postgres=> CREATE ROLE rds_pgaudit;
CREATE ROLE
postgres=>
postgres=> \du
                                                               List of roles
         Role name         |                   Attributes                   |                          Member of
---------------------------+------------------------------------------------+--------------------------------------------------------------
 pg_execute_server_program | Cannot login                                   | {}
 pg_monitor                | Cannot login                                   | {pg_read_all_settings,pg_read_all_stats,pg_stat_scan_tables}
 pg_read_all_settings      | Cannot login                                   | {}
 pg_read_all_stats         | Cannot login                                   | {}
 pg_read_server_files      | Cannot login                                   | {}
 pg_signal_backend         | Cannot login                                   | {}
 pg_stat_scan_tables       | Cannot login                                   | {}
 pg_write_server_files     | Cannot login                                   | {}
 postgres                  | Create role, Create DB                        +| {rds_superuser}
                           | Password valid until infinity                  |
 rds_ad                    | Cannot login                                   | {}
 rds_iam                   | Cannot login                                   | {}
 rds_password              | Cannot login                                   | {}
 rds_pgaudit               | Cannot login                                   | {}
 rds_replication           | Cannot login                                   | {}
 rds_superuser             | Cannot login                                   | {pg_monitor,pg_signal_backend,rds_replication,rds_password}
 rdsadmin                  | Superuser, Create role, Create DB, Replication+| {}
                           | Password valid until infinity                  |
- 次にパラメータグループで設定を追加します。
- 監査ログの出力設定のためのパラメータグループとして、以下のものを利用します。
【パラメータグループの内容】
| 項目 | 値 |
|---|---|
| パラメータグループファミリー | aurora-postgresql11 |
| タイプ | DB Cluster Parameter Group |
| グループ名 | testpostgresql11-paramatergroup (任意) |
| 説明 | testpostgresql11 (任意) |
※ DBクラスタパラメータグループとDBパラメータグループの関係性ですが、原則DBパラメータグループの設定が適用されます。DBパラメータグループがデフォルト値の場合、DBクラスタパラメータグループの設定が適用されます。
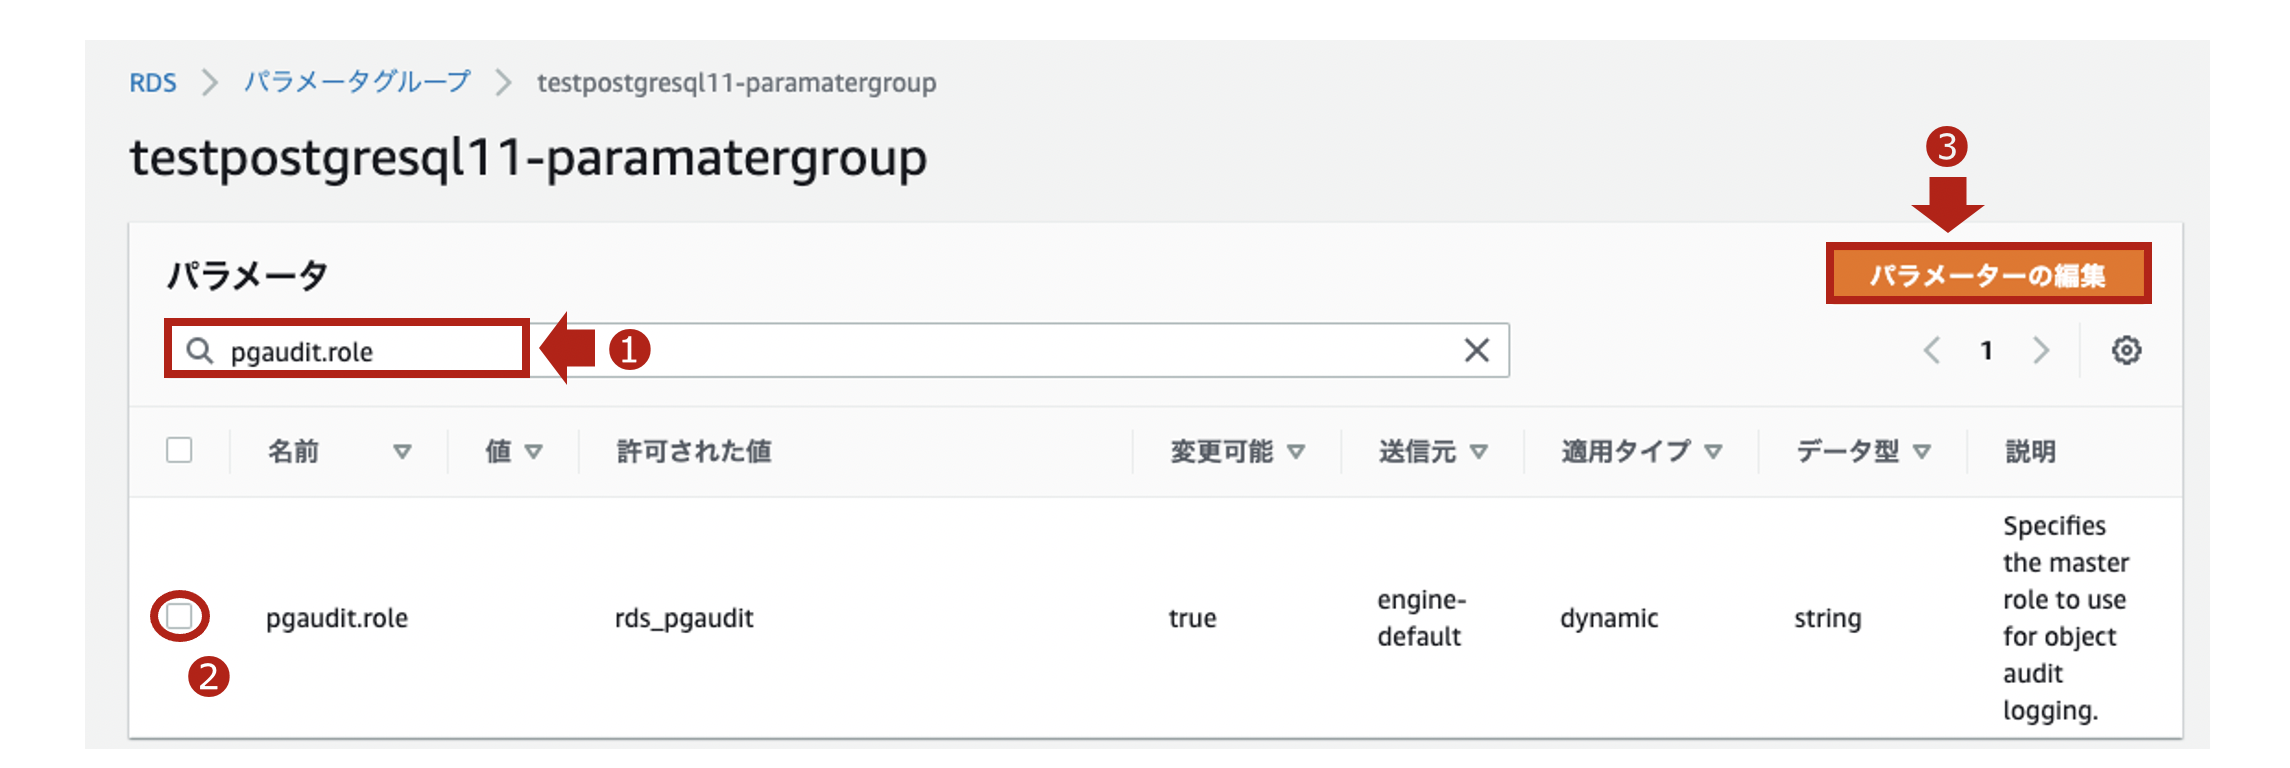
-
上記のパラメータグループにて、pgaudit.roleのパラメータを編集します。
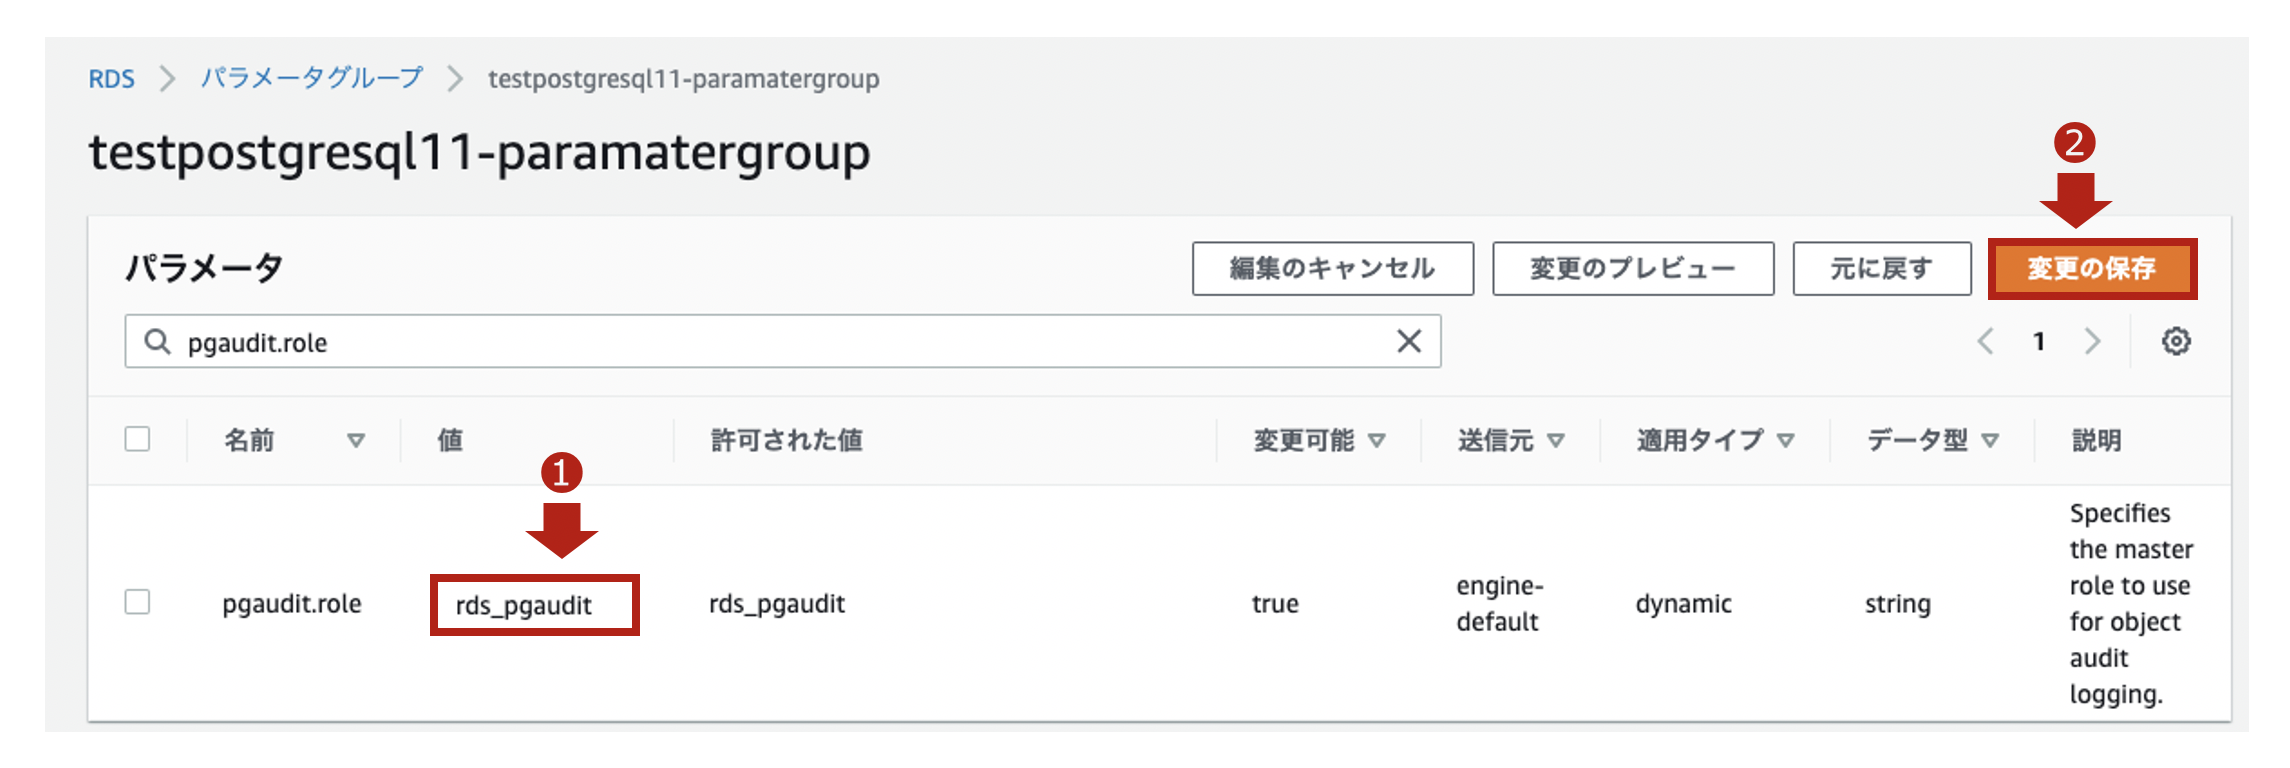
-
コマンドで作成したロール(rds_pgaudit)を設定して、保存します。
-
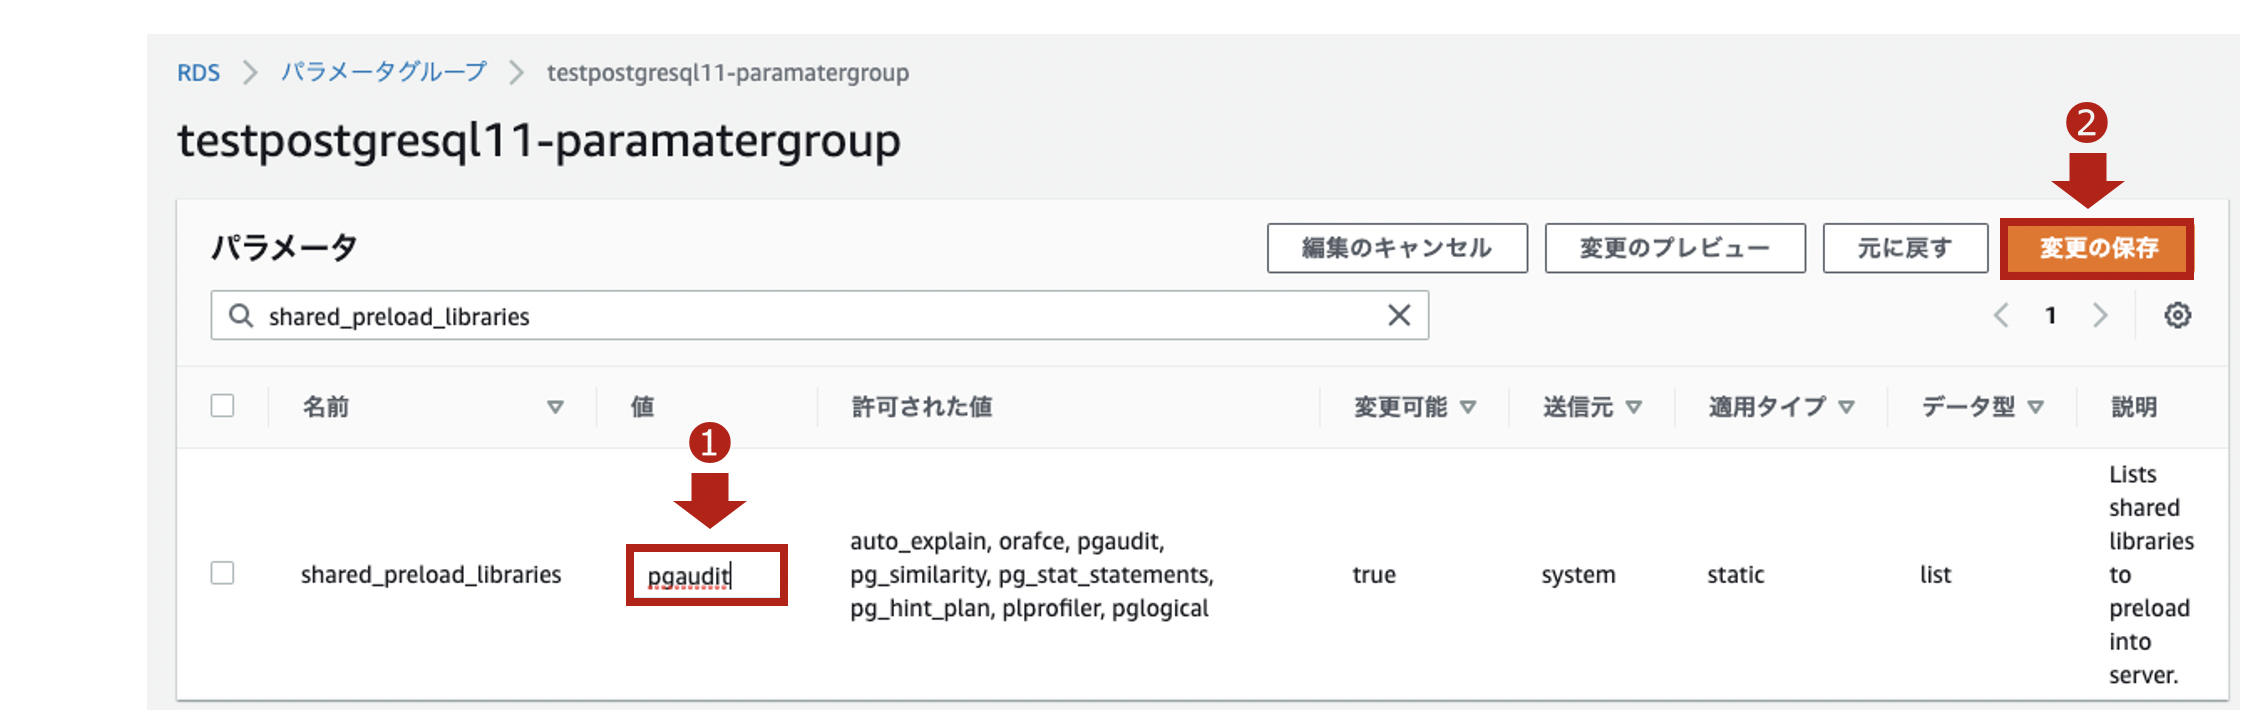
同じパラメータグループにて、次はshared_preload_librariesのパラメータを編集します。
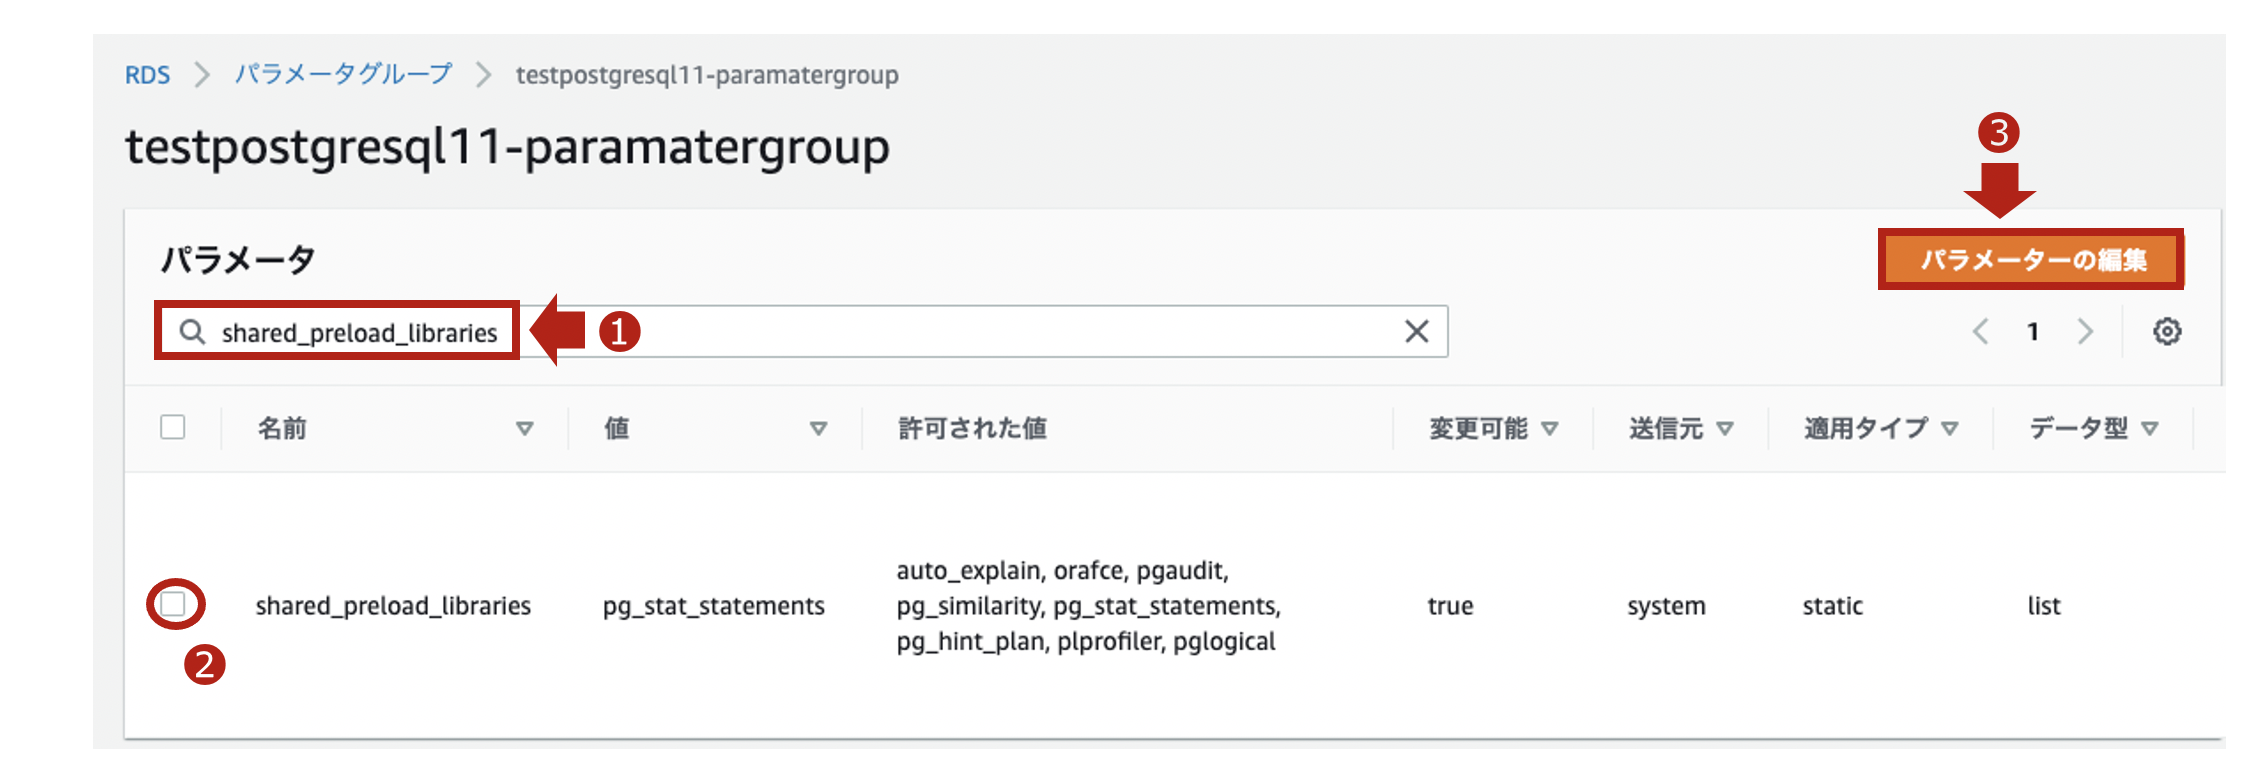
-
pgauditを設定することでpgAuditのライブラリを、共有メモリにロードします。
-
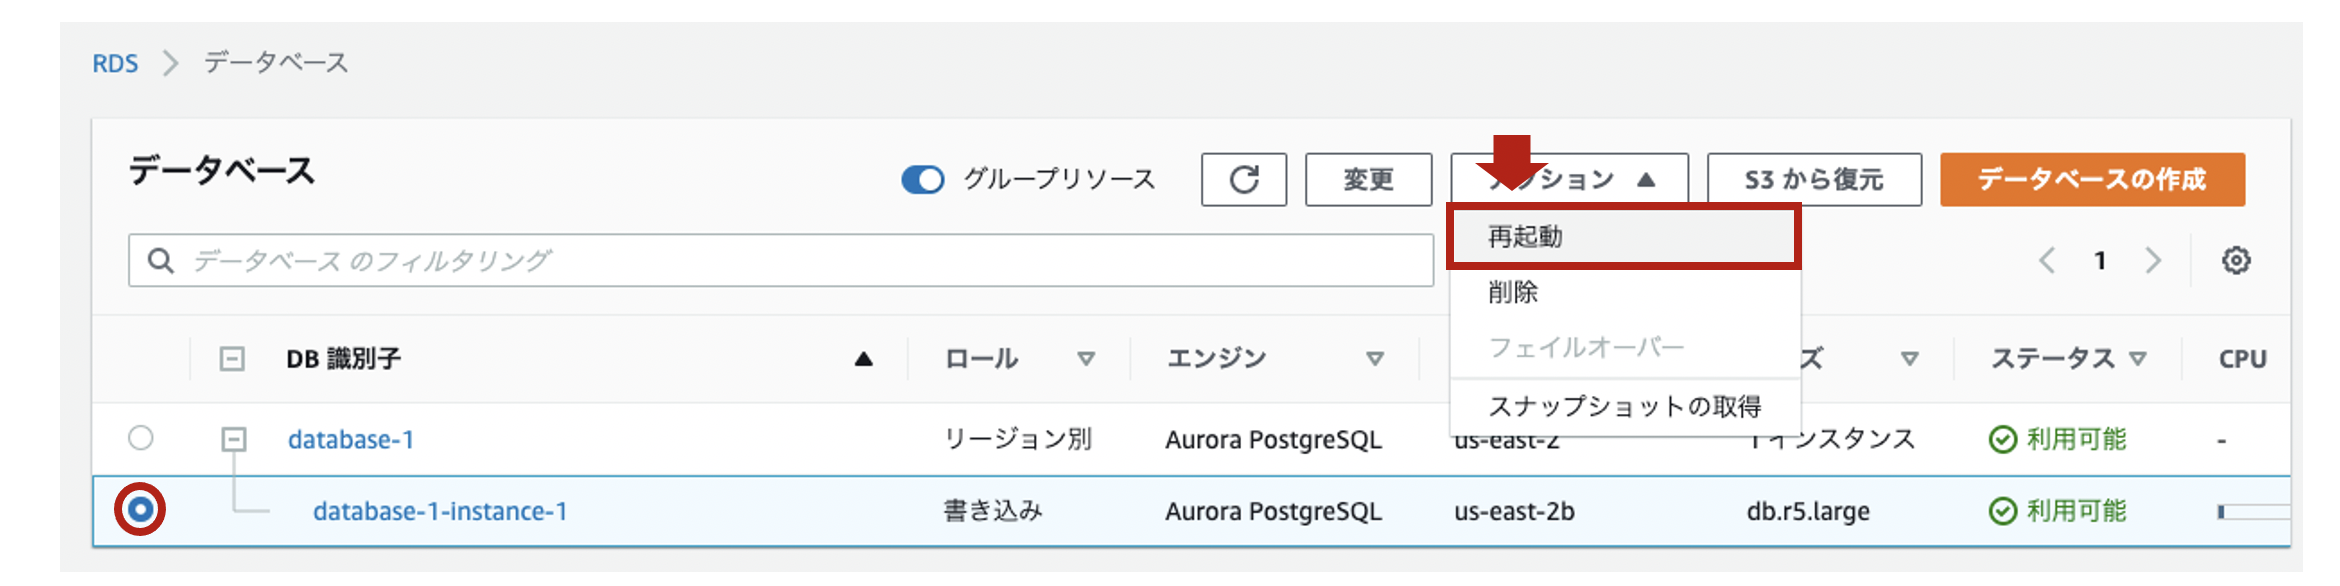
設定を反映させるため、DBインスタンスを再起動します。
-
再起動後、pgauditがちゃんとロードされていることを再接続して確認します。
$ psql -h [Auroraのエンドポイント] -U [マスターユーザ名]
Password for user postgres: xxxxxxxxxxx(パスワード)
psql (9.2.24, server 11.6)
WARNING: psql version 9.2, server version 11.0.
         Some psql features might not work.
SSL connection (cipher: ECDHE-RSA-AES256-GCM-SHA384, bits: 256)
Type "help" for help.

postgres=> show shared_preload_libraries;
 shared_preload_libraries
--------------------------
 rdsutils,pgaudit
(1 row)
- pgauditの拡張機能を有効にします。
postgres=> CREATE EXTENSION pgaudit;
CREATE EXTENSION
postgres=> \dx
                   List of installed extensions
  Name   | Version |   Schema   |           Description
---------+---------+------------+---------------------------------
 pgaudit | 1.3     | public     | provides auditing functionality
 plpgsql | 1.0     | pg_catalog | PL/pgSQL procedural language
(2 rows)
- 作成したロールに、pgauditがちゃんと紐付いていることを確認します。
postgres=> show pgaudit.role;
 pgaudit.role
--------------
 rds_pgaudit
(1 row)
【参考】
・pgaudit拡張機能の使用
・Auroraのパラメータグループの優先順位について実験してみた
2. 監査ログの確認
- GRANTコマンドでクエリ監査対象とするテーブル(今回はtesttable)を指定します。
- testtableに対して、SELECTコマンドでSQLクエリを実行します。
$ psql -h [Auroraのエンドポイント] -U [マスターユーザ名]
Password for user postgres: xxxxxxxxxxx(パスワード)
psql (9.2.24, server 11.6)
WARNING: psql version 9.2, server version 11.0.
         Some psql features might not work.
SSL connection (cipher: ECDHE-RSA-AES256-GCM-SHA384, bits: 256)
Type "help" for help.

postgres=> GRANT SELECT ON testtable TO rds_pgaudit;
GRANT
postgres=> SELECT * FROM testtable;
- [CloudWatch Logs]のロググループ配下のログストリームに以下のようなログが出力されます。(こちらが監査ログです。)
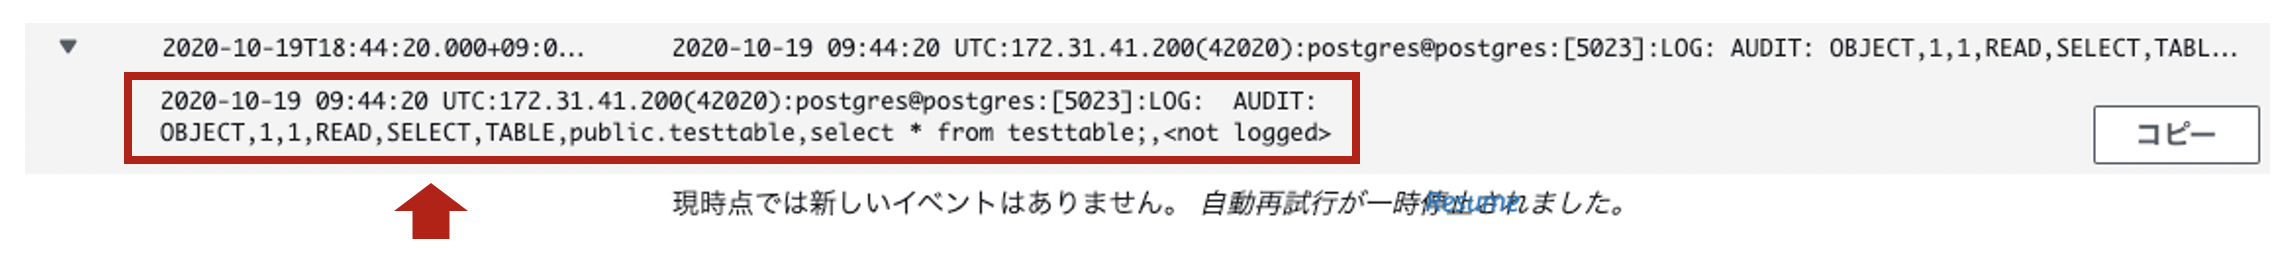
2020-10-19 10:49:24 UTC:172.31.41.200(44050):postgres@postgres:[27653]:LOG: AUDIT: OBJECT,1,1,READ,SELECT,TABLE,public.testtable,select name from testtable;,<not logged>
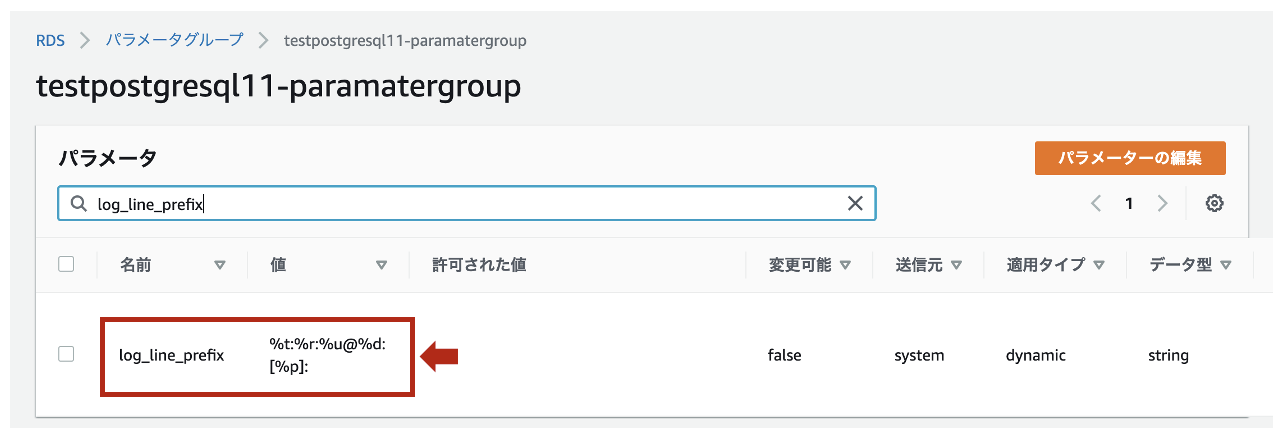
余談ですが、デフォルトのログフォーマットはlog_line_prefixで**%t:%r:%u@%d:[%p]:**と定義されています。
【参考】
・pgaudit拡張機能を使用する方法
・log_line_prefixの説明
3. Logstashの設定
- 監査ログは、正規表現パターンを使って以下のようなフィールドと値にパースします。
| フィールド | 値(サンプル) | データ型 |
|---|---|---|
| タイムスタンプ | 2020-10-19 10:49:24 | 日付型 |
| タイムゾーン | UTC | 文字列型 (keyword) |
| IPアドレス | 172.31.41.200 | IP型 |
| ポート番号 | 44050 | 文字列型 (keyword) |
| ユーザ名 | postgres | 文字列型 (keyword) |
| データベース名 | postgres | 文字列型 (keyword) |
| プロセスID | 27653 | 文字列型 (keyword) |
| ログレベル | LOG | 文字列型 (keyword) |
| ログタイプ | AUDIT | 文字列型 (keyword) |
| 認証タイプ | OBJECT | 文字列型 (keyword) |
| ステートメントID | 1 | 文字列型 (keyword) |
| サブステートメントID | 1 | 文字列型 (keyword) |
| クラス | READ | 文字列型 (keyword) |
| コマンド | SELECT | 文字列型 (keyword) |
| オブジェクトタイプ | TABLE | 文字列型 (keyword) |
| オブジェクト名 | public.tessttable | 文字列型 (keyword) |
| クエリ文 | select * from testtable; | 文字列型 (text) |
| パラメータ | <not logged> | 文字列型 (keyword) |
- Grokパターン(
/etc/logstash/grok_patterns/aurora-postgresql-auditlog)を保存するディレクトリを作成します。
※ すでにgrok_patternsディレクトリが存在する場合、ファイルのみ作成してください。
$ sudo mkdir /etc/logstash/grok_patterns
$ sudo vi /etc/logstash/grok_patterns/aurora-postgresql-auditlog
- 下記の内容を上記のGrokパターンファイルに記述します。
### PosgreSQL auditLog
POSTGRESQL_AUDITLOG %{TIMESTAMP_ISO8601:timestamp} %{TZ:timezone}:%{IP:ipaddress}\(%{NUMBER:src_port}\):%{WORD:username}@%{WORD:database}:\[%{NUMBER:process_id}\]:%{WORD:log_level}:\s*%{WORD:log_type}: %{WORD:audit_type},%{NUMBER:statement_id},%{NUMBER:substatement_id},%{WORD:class},%{WORD:command},(?:|%{WORD:object_type}),(?:|%{DATA:object_name}),(?:%{DATA:statement}),%{GREEDYDATA:parameter}
- 下記のパイプライン構成ファイル(
/etc/logstash/conf.d/logstash.conf)を作成します。
(このタイミングではLogstashのプロセスは起動しません)
$ sudo vi /etc/logstash/conf.d/logstash.conf
- 下記の内容を上記のパイプライン構成ファイルに記述します。
input {
  cloudwatch_logs {
    log_group => [ "/aws/rds/cluster/database-1/postgresql" ]
    region => "us-east-2"
    interval => 5
  }
}

filter {
  if "AUDIT:" in [message] {
    ### 読み込むGrok Patternファイルを"patterns_dir"で指定
    grok {
      patterns_dir => [ "/etc/logstash/grok_patterns" ]
      match => { "message" => "%{POSTGRESQL_AUDITLOG}" }
    }
    ### dateフィールドから@timestampを抽出
    date {
      match => [ "timestamp", "yyyy-MM-dd HH:mm:ss" ]
      timezone => "UTC"
      target => "@timestamp"
    }
    ### @timstampから日本時間を抽出
    ruby {
      code => "event.set('[@metadata][local_time]',event.get('[@timestamp]').time.localtime.strftime('%Y-%m-%d'))"
    }
    ### document_idに利用する一意のIDを作成
    fingerprint {
      source => "message"
      target => "[@metadata][fingerprint]"
      method => "MURMUR3"
    }
    ### デフォルトの型がstringのため、フィールド定義で定義した型に変換
    mutate {
      ### typeフィールドを追加
      add_field => { "type" => "aurora-postgre-auditlog-cwl" }
      ### 不要なフィールドを削除
      remove_field => [ "timestamp", "timezone" ]
    }
  }
}

output {
  if [log_type] == "AUDIT" {
    ### 出力先のAmazonESのIndexを指定
    elasticsearch {
      hosts => [ "https://search-test-es-xxxxxxxxxxxxxxxxxxxxxx.us-east-2.es.amazonaws.com:443" ]
      index => "%{type}-%{[@metadata][local_time]}"
      document_id => "%{[@metadata][fingerprint]}"
      ilm_enabled => false
    }
  }
}
【参考】
・pgAudit: PostgreSQL Audit Logging
4. Kibanaでの設定
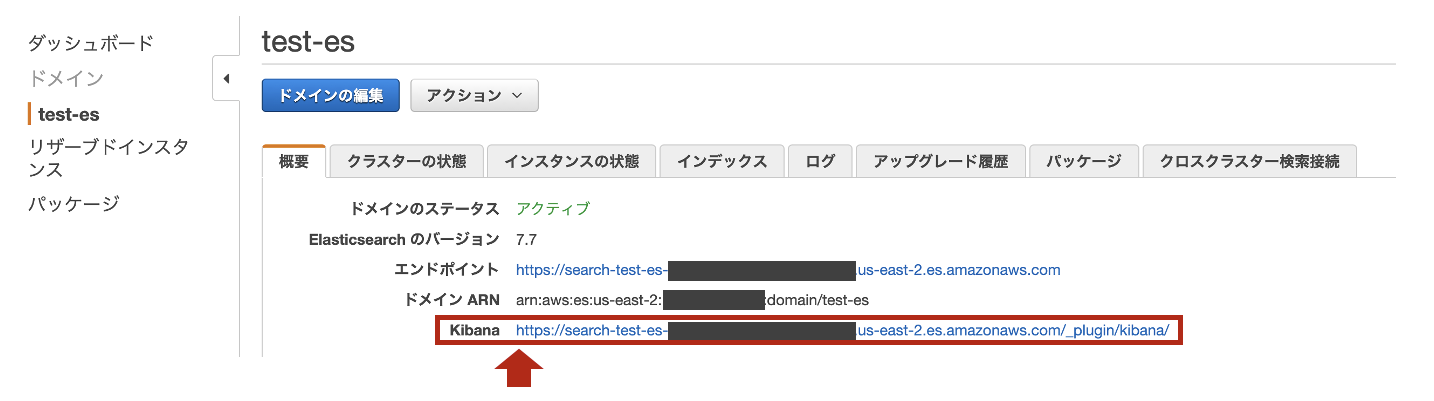
-
Amazon ESの
KibanaのURLをクリックします。
-
[Dev Tools]のConsoleからAurora PostgreSQLの監査ログのIndex Templateを追加します。
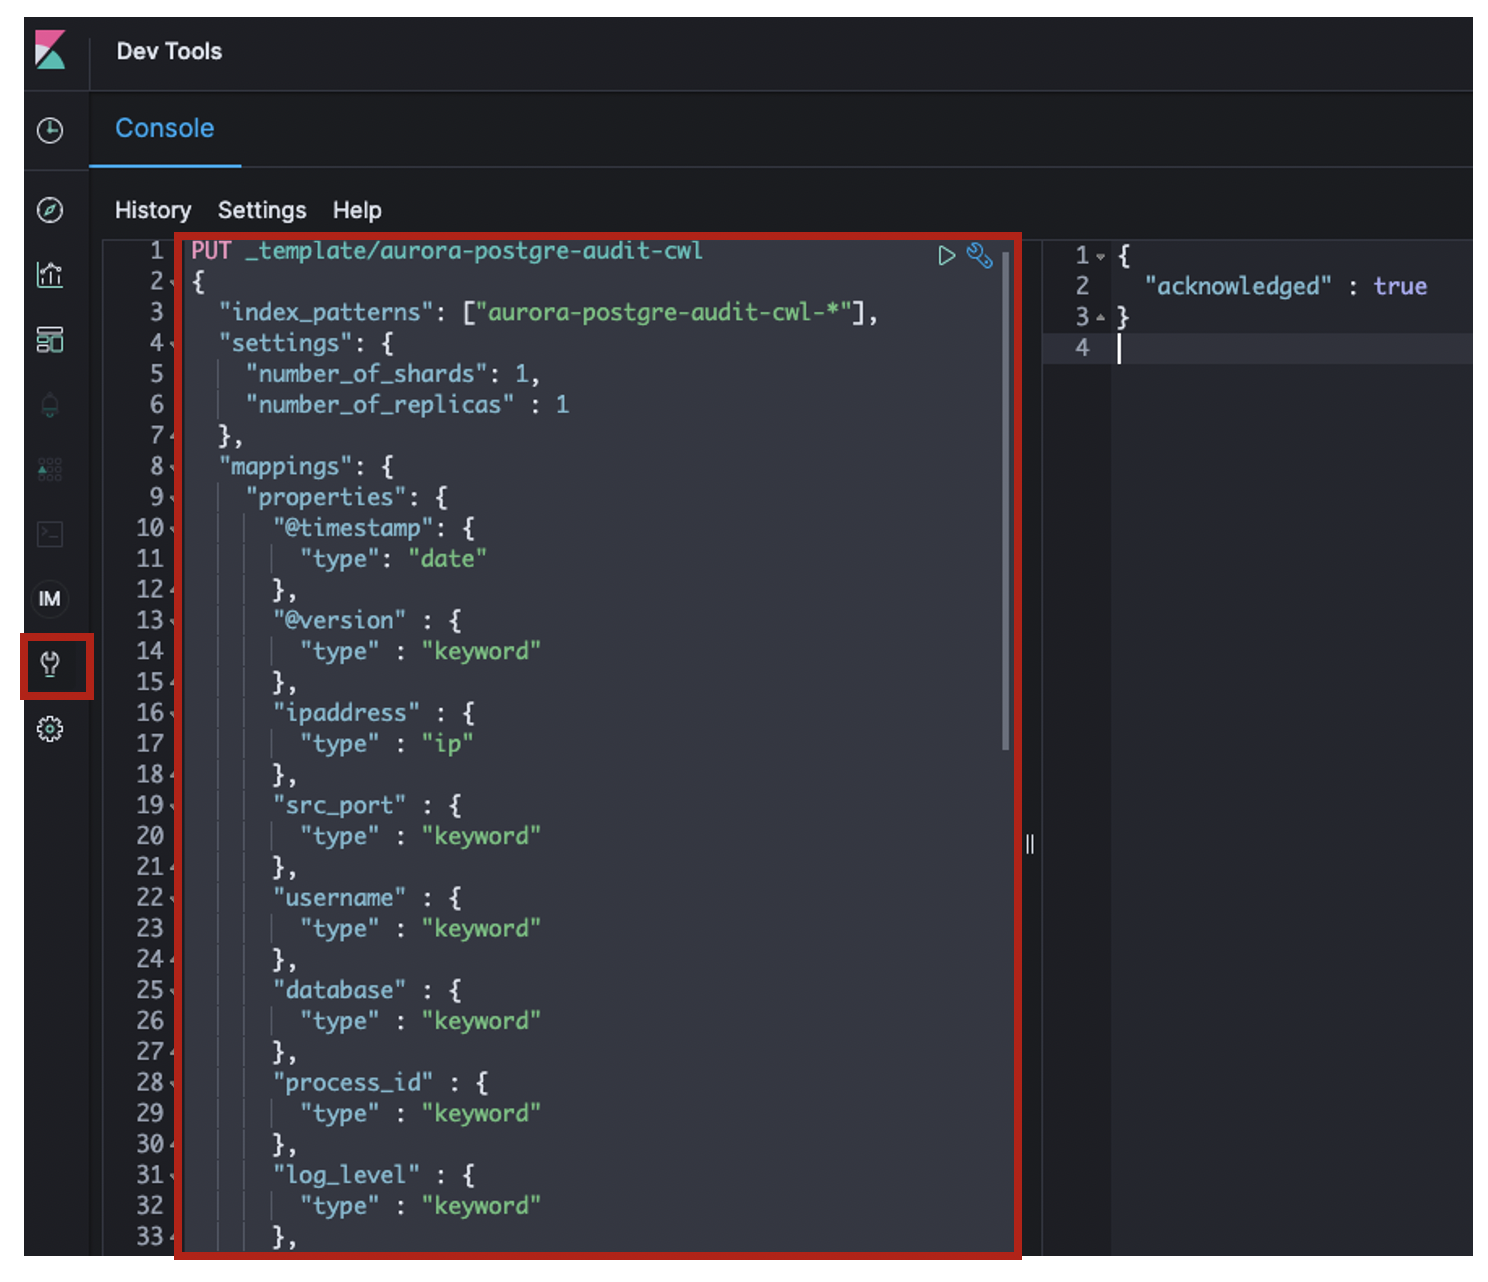
-
上記で張り付けたIndex Templateは以下の通りです。
PUT _template/aurora-postgre-auditlog-cwl
{
  "index_patterns": ["aurora-postgre-audit-cwl-*"],
  "settings": {
    "number_of_shards": 1,
    "number_of_replicas" : 1
  },
  "mappings": {
    "properties": {
      "@timestamp": {
        "type": "date"
      },
      "@version" : {
        "type" : "keyword"
      },
      "ipaddress" : {
        "type" : "ip"
      },
      "src_port" : {
        "type" : "keyword"
      },
      "username" : {
        "type" : "keyword"
      },
      "database" : {
        "type" : "keyword"
      },
      "process_id" : {
        "type" : "keyword"
      },
      "log_level" : {
        "type" : "keyword"
      },
      "log_type" : {
        "type" : "keyword"
      },
      "audit_type" : {
        "type" : "keyword"
      },
      "statement_id" : {
        "type" : "keyword"
      },
      "substatement_id" : {
        "type" : "keyword"
      },
      "class" : {
        "type" : "keyword"
      },
      "command" : {
        "type" : "keyword"
      },
      "object_type" : {
        "type" : "keyword"
      },
      "object_name" : {
        "type" : "keyword"
      },
      "statement" : {
        "type": "text",
        "fields": {
          "keyword": {
            "type": "keyword",
            "ignore_above": 8191
          }
        }
      },
      "parameter" : {
        "type" : "keyword"
      },
      "type" : {
        "type" : "keyword"
      },
      "tags" : {
        "type" : "keyword"
      },
      "message" : {
        "type" : "text"
      },
      "cloudwatch_logs" : {
        "properties" : {
          "event_id" : {
            "type" : "keyword"
          },
          "ingestion_time" : {
            "type" : "date"
          },
          "log_group" : {
            "type" : "keyword"
          },
          "log_stream" : {
            "type" : "keyword"
          }
        }
      }
    }
  }
}
※クエリ文が含まれるフィールド(statement)は、全文検索ができるようtext型で格納しつつ、グラフ化できるようkeyword型でも格納しています。
※Luceneのトークンの上限値である32,766バイトを超えて破棄されないよう、推奨値8,191で制限しています。
- Logstashを再起動します。
$ sudo systemctl restart logstash
$ sudo systemctl status logstash
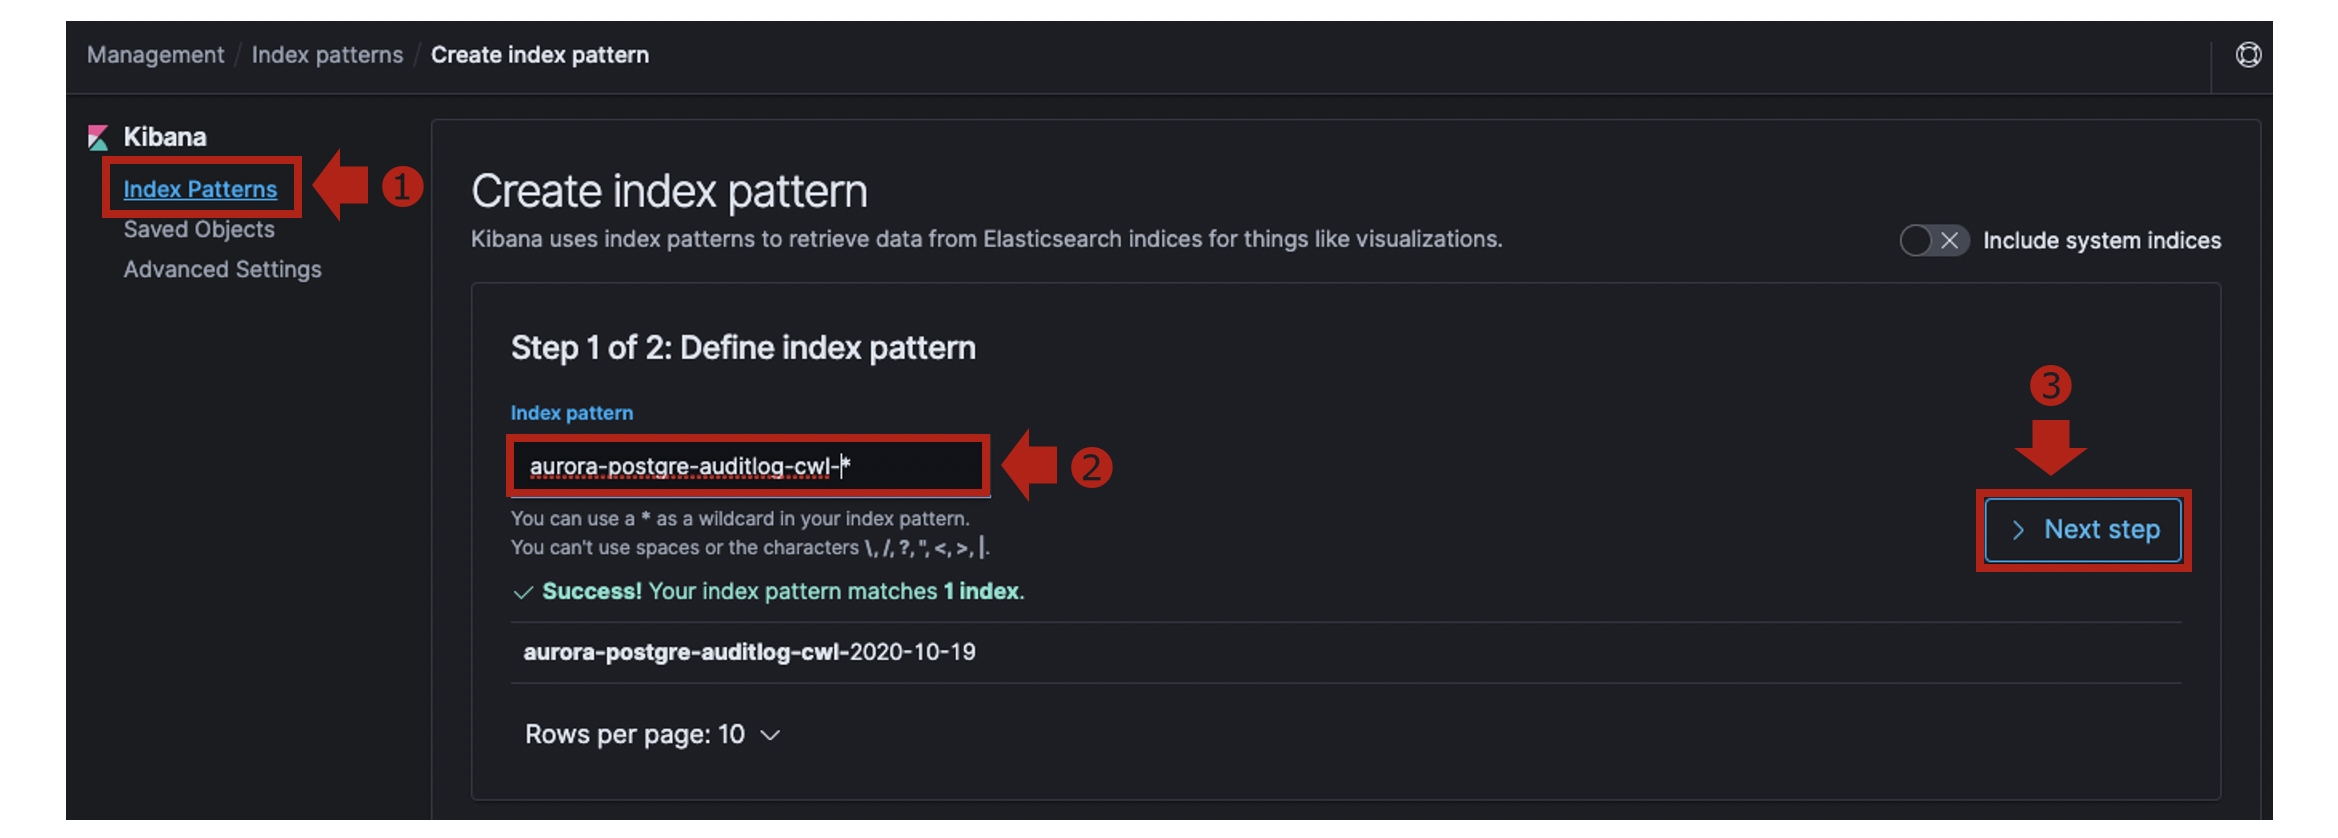
-
Kibanaの [Management] > [Index Patterns]でCreate index patternをクリックします。
-
aurora-postgre-auditlog-cwl-*という名前でIndex Patternを作成します。
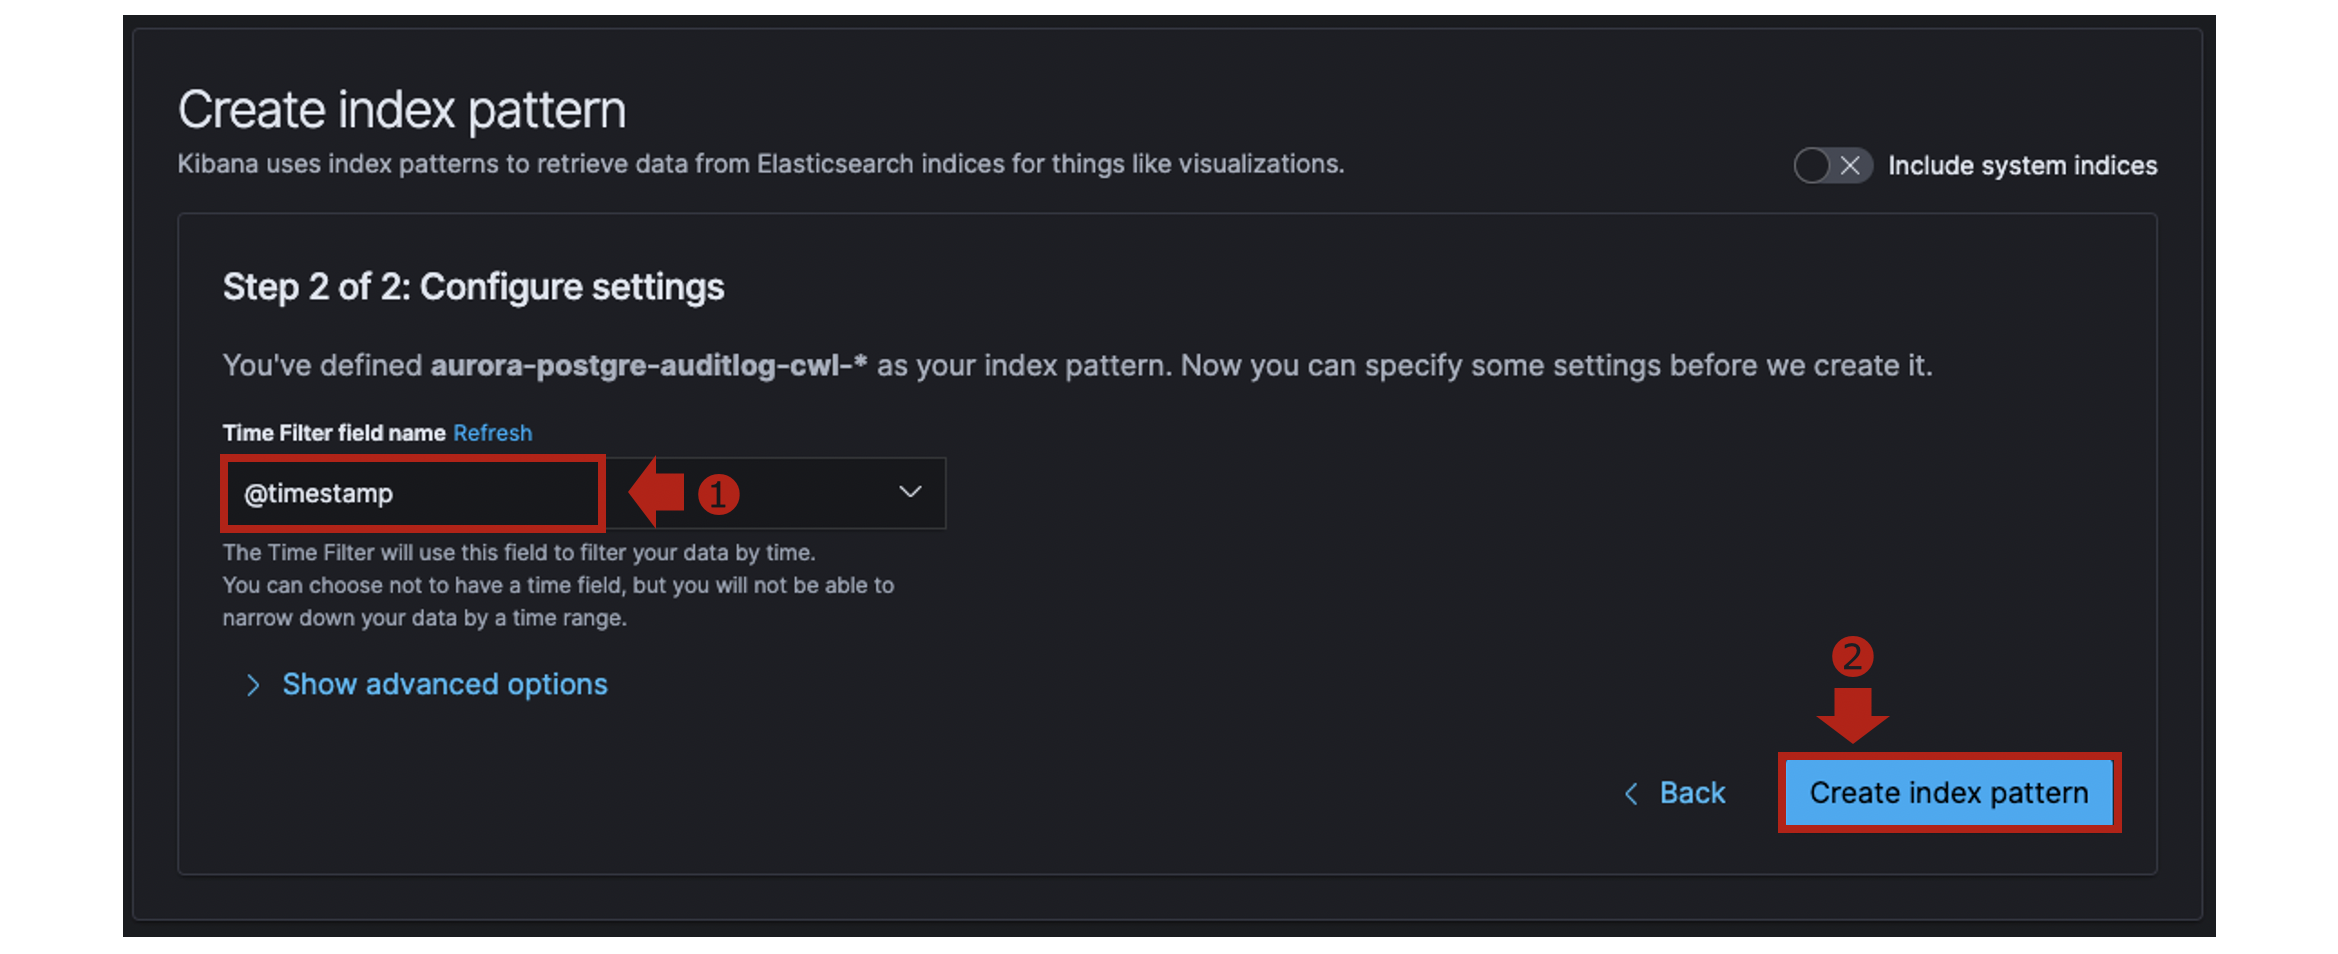
-
@timestampを指定します。
-
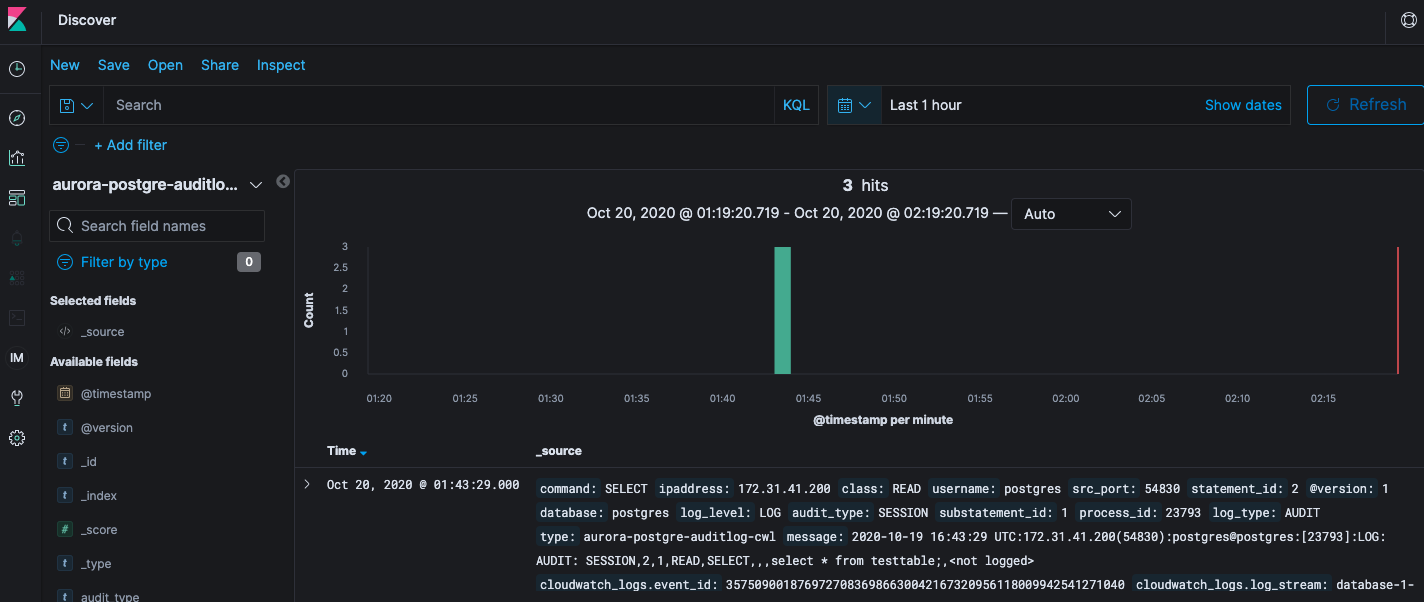
[Discover]を開き、Index Patternに
aurora-postgre-auditlog-cwl-*を指定します。 -
デフォルトでは直近15分間のログが表示されます。表示されていればOKです。
-
取り込んだ監査ログは以下のようになっています。
{
  "_index": "aurora-postgre-auditlog-cwl-2020-10-19",
  "_type": "_doc",
  "_id": "2763317557",
  "_version": 1,
  "_score": null,
  "_source": {
    "command": "SELECT",
    "ipaddress": "172.31.41.200",
    "class": "READ",
    "username": "postgres",
    "src_port": "54830",
    "statement_id": "2",
    "@version": "1",
    "database": "postgres",
    "log_level": "LOG",
    "audit_type": "SESSION",
    "substatement_id": "1",
    "process_id": "23793",
    "log_type": "AUDIT",
    "type": "aurora-postgre-auditlog-cwl",
    "message": "2020-10-19 16:43:29 UTC:172.31.41.200(54830):postgres@postgres:[23793]:LOG:  AUDIT: SESSION,2,1,READ,SELECT,,,select * from testtable;,<not logged>",
    "cloudwatch_logs": {
      "event_id": "35750900187697270836986630042167320956118009942541271040",
      "log_stream": "database-1-instance-1.0",
      "log_group": "/aws/rds/cluster/database-1/postgresql",
      "ingestion_time": "2020-10-19T16:43:30.109Z"
    },
    "@timestamp": "2020-10-19T16:43:29.000Z",
    "statement": "select * from testtable;",
    "parameter": "<not logged>"
  },
  "fields": {
    "cloudwatch_logs.ingestion_time": [
      "2020-10-19T16:43:30.109Z"
    ],
    "@timestamp": [
      "2020-10-19T16:43:29.000Z"
    ]
  },
  "sort": [
    1603125809000
  ]
}
まとめ
さて、いかがでしたでしょうか?
statementフィールド値にSQLクエリ文がそのまま含まれています。
データ型をtext型でスキーマ定義したので、クエリ文を全文検索することが可能になっています。
不正なSQLクエリが実行されていないか、DB監査ログから分析してみてはいかがでしょうか?