ECサイトなどでデータ分析やっていると「売上が下がった原因を調べてくれ」とかよく言われる。
調べてみると確かに売上が減っている。
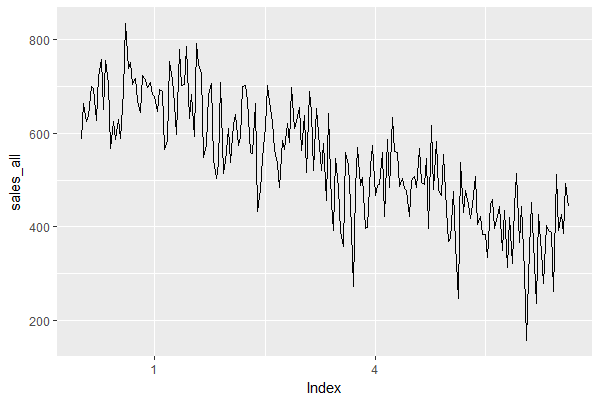
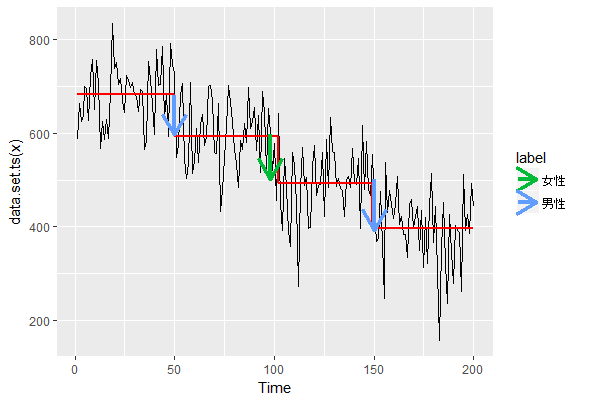
これを changepoint パッケージで変化点を検出してみる。
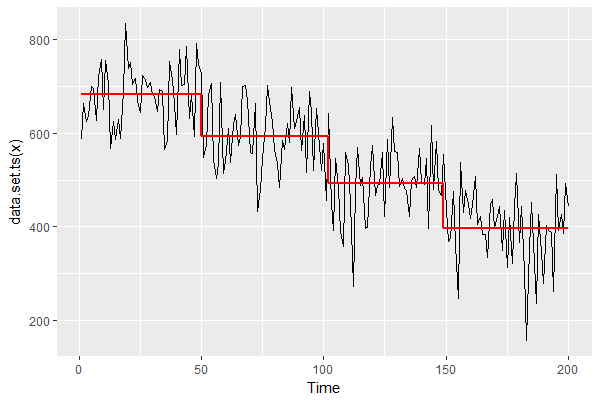
売上の変化点が3つ検出された。
これに対して、売上を男女別に分けてみる。
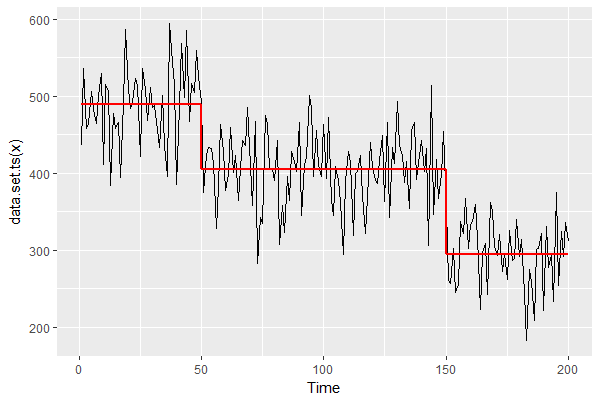
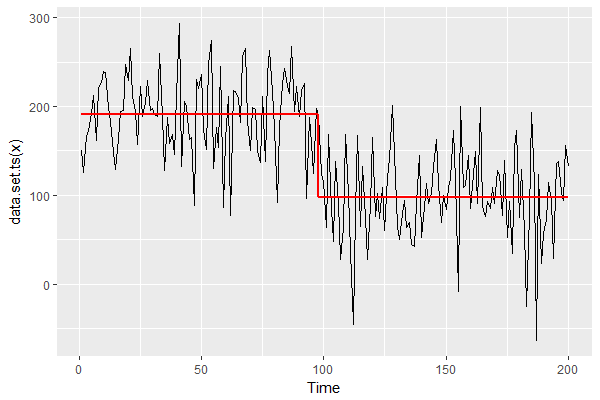
上が男性、下が女性。
1番目と3番目の変化は男性によるもの、2番目の変化は女性によるものである。
これを可視化したい。
changepointExt パッケージというものを作った。
R
# 男女別の売上を作成 -------------------------------------------------------------
set.seed(314)
sales_male <- c(rnorm( 50, mean = 500, sd = 50),
                rnorm(100, mean = 400, sd = 50),
                rnorm( 50, mean = 300, sd = 50))
sales_female <- c(rnorm(100, mean = 200, sd = 50),
                  rnorm(100, mean = 100, sd = 50))
# 合計したものが全体の売上
sales_all <- sales_male + sales_female


# 変化点検出 -------------------------------------------------------------------
library(changepoint)

cpt_all <- cpt.meanvar(sales_all, method = "PELT")
cpt_male <- cpt.meanvar(sales_male, method = "PELT")
cpt_female <- cpt.meanvar(sales_female, method = "PELT")


# 可視化 ---------------------------------------------------------------------
library(changepointExt)

combi <- combine_cpts("男性" = cpt_male, "女性" = cpt_female)
autoplot(cpt_all) + autolayer(combi)
Enjoy!