はじめに
前回Rで基礎分析結果をCSV出力①全体編にて、データ型と欠損数を出力した。続いて、量的変数について扱う。
量的変数と質的変数の分割
default of credit card clients Data Setの説明によると、データは以下のような属性をもつ。
Attribute Information:
This research employed a binary variable, default payment (Yes = 1, No = 0), as the response variable. This study reviewed the literature and used the following 23 variables as explanatory variables:
X1: Amount of the given credit (NT dollar): it includes both the individual consumer credit and his/her family (supplementary) credit.
X2: Gender (1 = male; 2 = female).
X3: Education (1 = graduate school; 2 = university; 3 = high school; 4 = others).
X4: Marital status (1 = married; 2 = single; 3 = others).
X5: Age (year).
X6 - X11: History of past payment. We tracked the past monthly payment records (from April to September, 2005) as follows: X6 = the repayment status in September, 2005; X7 = the repayment status in August, 2005; . . .;X11 = the repayment status in April, 2005. The measurement scale for the repayment status is: -1 = pay duly; 1 = payment delay for one month; 2 = payment delay for two months; . . .; 8 = payment delay for eight months; 9 = payment delay for nine months and above.
X12-X17: Amount of bill statement (NT dollar). X12 = amount of bill statement in September, 2005; X13 = amount of bill statement in August, 2005; . . .; X17 = amount of bill statement in April, 2005.
X18-X23: Amount of previous payment (NT dollar). X18 = amount paid in September, 2005; X19 = amount paid in August, 2005; . . .;X23 = amount paid in April, 2005.
1, 5, 12-23列目のカラムが量的変数、2-4, 6-11, 24列目が質的変数となっているので、それら2つに分割する。(なお d および h は前記事Rで基礎分析結果をCSV出力①全体編ですでに読み込み済み。)
# divide the data into 2 parts (1: quantity, 2: quality)
quantity.idx <- c(1, 5, 12:23)
quality.idx  <- c(2:4, 6:11, 24)

d.1 <- d[, quantity.idx]
d.2 <- d[, quality.idx]
h.1 <- data.frame(header[quantity.idx, ])
h.2 <- data.frame(header[quality.idx, ])
names(h.1)[1] <- "ROWNAMES"
names(h.2)[1] <- "ROWNAMES"
量的変数の基礎統計量をCSV出力
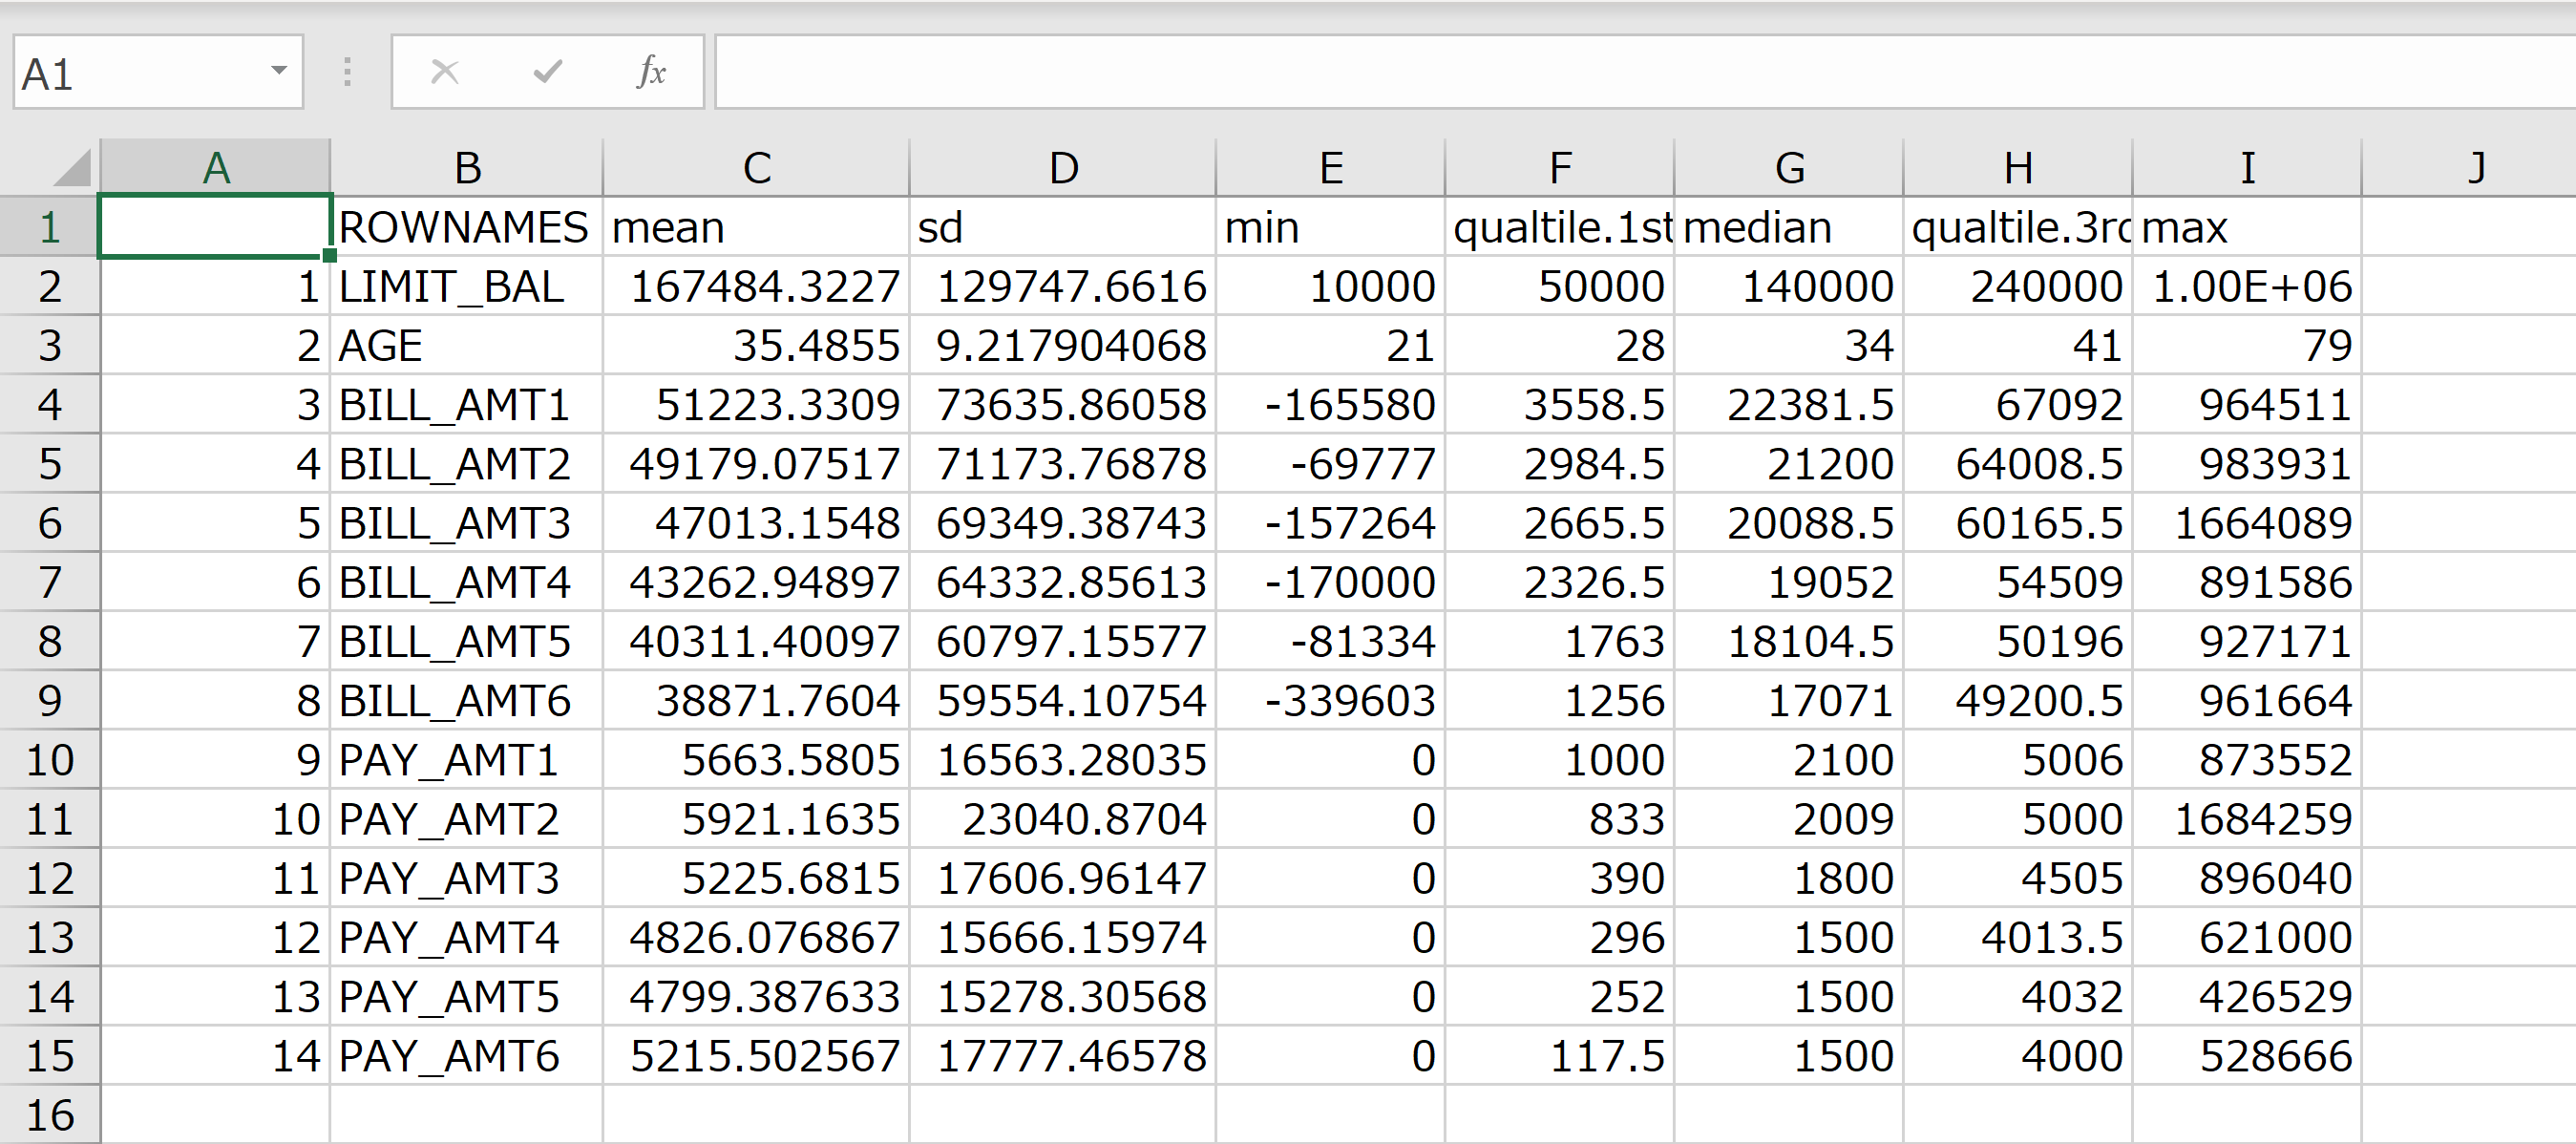
量的変数に関して、平均値、標準偏差、最小値、第1四分位、中央値、第3四分位、最大値の7項目を求め、その後ヘッダーにひもづけてCSV形式にて出力。
five <- data.frame()
for (i in 1:length(d.1)) {
  five <- rbind(five, c(fivenum(d.1[, i])))
}

h.1$mean <- sapply(d.1, mean, na.rm=TRUE)
h.1$sd <- sapply(d.1, sd, na.rm=TRUE)
h.1$min <- five[, 1]
h.1$qualtile.1st <- five[, 2]
h.1$median <- five[, 3]
h.1$qualtile.3rd <- five[, 4]
h.1$max <- five[, 5]

write.csv(x=h.1, file="stats.csv")
出力結果は以下のようになる。
以降の記事で質的変数の基礎分析を行って、CSV形式で出力をしていく。
