はじめに
この記事はReact#2 Advent Calendar 2019 18日目の記事です。
タイトル通り、Reactでのデータ可視化に関する内容になっています。
ダッシュボードを初めとしたデータビジュアライズの絡む開発をReactでするなら、React-Visってライブラリもなかなか良いよ!ということで書きました。
個人的な背景としては、Reactベースでのプロダクト開発において、Reactのライフサイクルやコンポーネント設計に合わせて作られた可視化ライブラリはないのかな?、と思い探していたところ見つけたのがReact-Visなので、似たような思いをお持ちの方がいたら参考になるかもしれません?(元々は似た理由でrechartsを使っていました)
React-Visとは?
Uber社のOpen Source Projectの1つで、githubに公開されています。Star 6.6k(2019/12/18時点)でなかなかと思うのですが、日本語記事が探しても見つからなかったので、使っている方がいたら教えて欲しいですね。
github: https://github.com/uber/react-vis
公式HP: https://uber.github.io/react-vis/
なぜReact-Vis?
データを可視化するライブラリならD3やChartJS, ThreeJSなどの有名どころがあって、それらの表現力はReact-Vis以上の部分も多く、事足りてはいます。それならわざわざReact特化のライブラリを使う必要などないケースも多いでしょうが、個人的には
1.React Componentとして記述し構成できる点
2.パフォーマンス
に魅力を感じています。
1つ目は、グラフの構成要素(ラベルや軸の範囲やアニメーションなど)にComponentと同様でStateを仕込めば、Stateの更新によってグラフの描画もインタラクティブに更新できます。React Componentと同じ感覚で設計して記述できるのがありがたいですね。
2つ目は、感覚的な話ですが、SPAで要素が1,000や10,000~とかのデータポイント多めのグラフを複数描画していく際のパフォーマンスに違いを感じます。ただこの辺はバックエンドでの処理も重要ですし、比較検証テストをちゃんとした訳でもないので、違いは追々書きたいと思います。
また、Reactベースでプロダクト開発をしている身としては、React-Visが掲げる下記の原則にも魅力を感じました。
(意訳)
[React-friendly]
React-VisはReact Componentと同様に機能する設計となっており、properties, children, callbacksをもって構成できる
[High-level and customizable]
React-Visはシンプルなコードとデフォルトの設定でも複雑なチャートを作成することができるが、個々のパーツをあなたが好きな様にカスタマイズすることもできる
[Industry-strong]
React-VisはUberの様々な内部ツールをサポートする目的で開発されている
全て自分がライブラリに求めていたものですが、3番目の[Industory strong]が自分にとっては結構重要でした。
Uberのプロダクトが特徴として持つ、地理空間情報や機械学習というビッグデータの可視化と隣合わせの状況で、それらに対するパフォーマンスを重視して開発されている(であろう)ライブラリというのは魅力的です。
(個人事情ですが、少なからず類似性のあるプロダクトを扱っているため)
逆にデメリットというか、不安な点としては、まだTypescriptに対応していないことですかね。。有志でreact-vis.d.tsを提供してくれてる方がいますが、@typesはなしなので、時々自分で型を付けています。
どんな感じで書けるの?
前置きが長くなりましたが、最小構成で代表的なグラフを書いてみます。
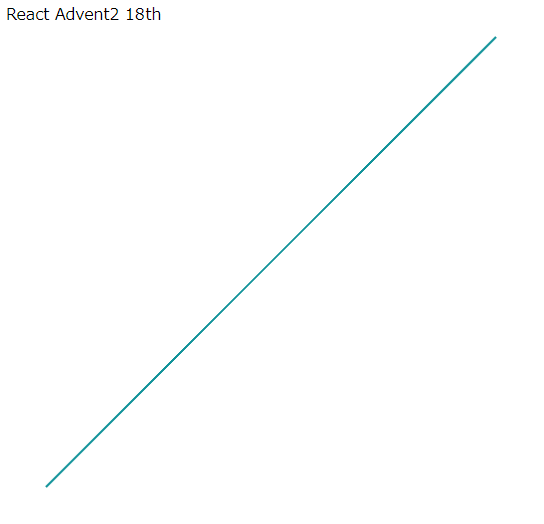
LineSeries(折れ線グラフ)
import React from "react";
import { XYPlot, LineSeries } from "react-vis";

interface SamplePropsTypes {
  width: number;
  height: number;
}

interface DataTypes {
  x: number;
  y: number;
}

const SampleLine = (props: SamplePropsTypes) => {
  const data: DataTypes[] = [
    { x: 0, y: 18 },
    { x: 1, y: 19 },
    { x: 2, y: 20 },
    { x: 3, y: 21 },
    { x: 4, y: 22 },
    { x: 5, y: 23 },
    { x: 6, y: 24 },
    { x: 7, y: 25 },
  ];

  return (
    <div>
      React Advent2 18th
      <XYPlot width={props.width} height={props.height}>
        <LineSeries data={data} />
      </XYPlot>
    </div>
  );
};
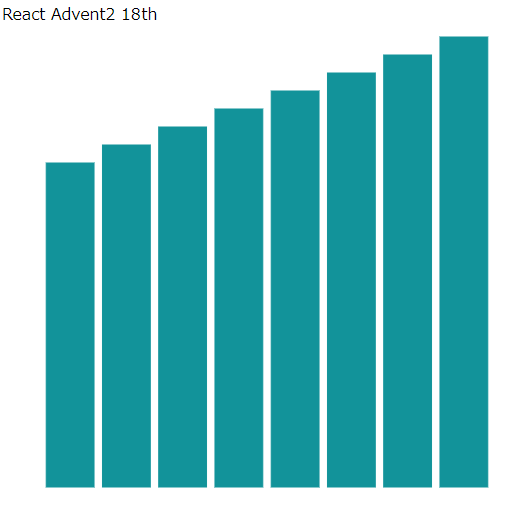
VerticalBarSeries(棒グラフ 縦ver)
// 上記コードに追加・変更
import { VerticalBarSeries } from "react-vis";

return (
  <div>
    React Advent2 18th
   <XYPlot width={props.width} height={props.height}>
     <VerticalBarSeries data={data} />
   </XYPlot>
  </div>
)
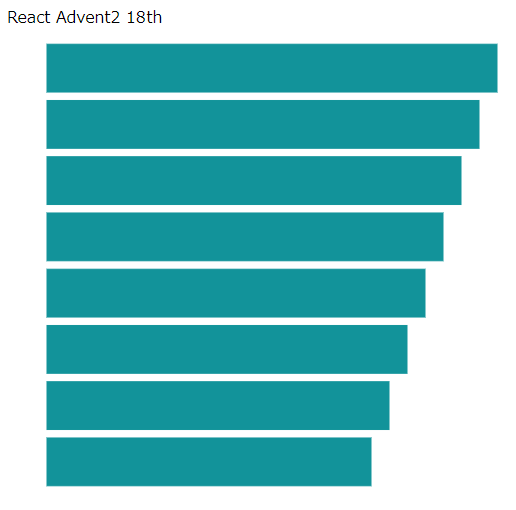
HorizontalBarSeries(棒グラフ 横ver)
// 上記コードに追加・変更
import { HorizontalBarSeries } from "react-vis";

const dataHorizontal: DataTypes[] = [
  { y: 0, x: 18 },
  { y: 1, x: 19 },
  { y: 2, x: 20 },
  { y: 3, x: 21 },
  { y: 4, x: 22 },
  { y: 5, x: 23 },
  { y: 6, x: 24 },
  { y: 7, x: 25 },
];

return (
  <div>
    React Advent2 18th
    <XYPlot width={props.width} height={props.height}>
      <HorizontalBarSeries data={dataHorizontal} />
    </XYPlot>
  </div>
);
Horizontalな棒グラフは軸が入れ替わるので、入力するデータのx, yも入れ替わるのが少しややこしいですね。
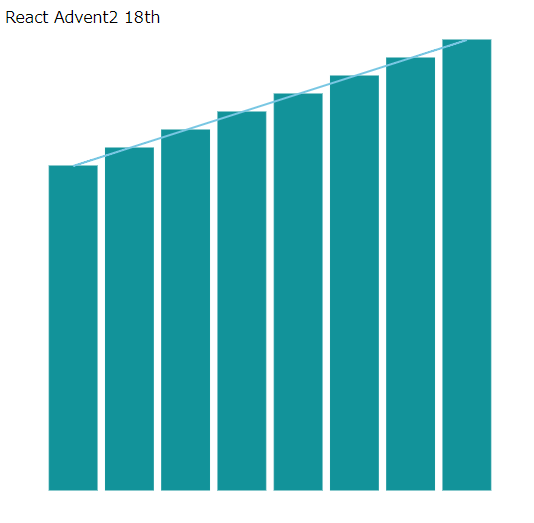
各パーツがReact Componentとしてexportされているので、リファレンスラインの挿入なんかもLineSeriesを使って組み込める部分など、直感的でよいなーと思います。
リファレンスラインの挿入
  return (
    <div>
      React Advent2 18th
      <XYPlot width={props.width} height={props.height}>
        <VerticalBarSeries data={data} />
        <LineSeries data={data} />
      </XYPlot>
    </div>
  );
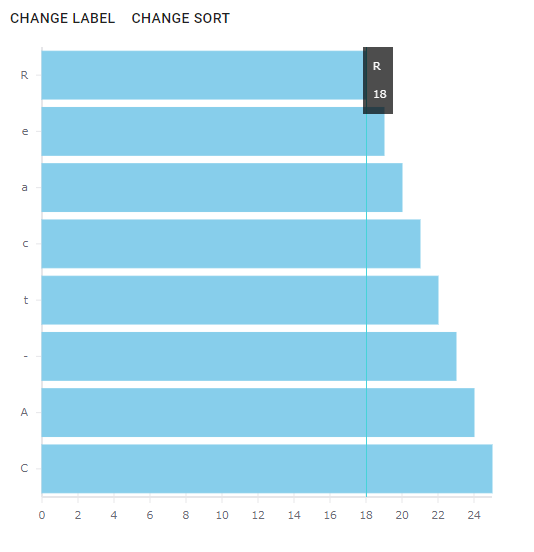
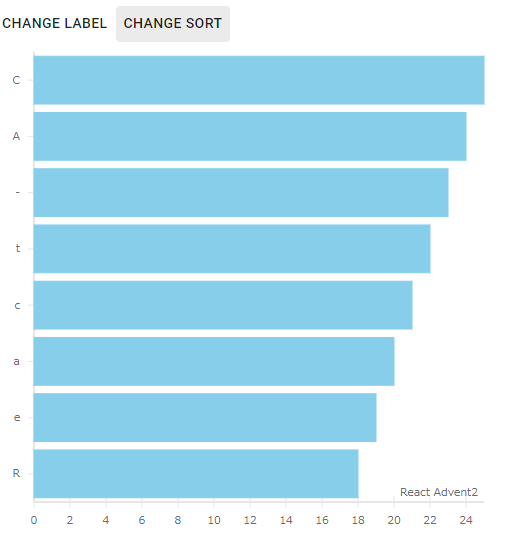
ちょっと描画をリッチにするとこんな感じです。
import React, { useState, useEffect } from "react";
import { makeStyles } from "@material-ui/core/styles";
import Button from "@material-ui/core/Button";
import {
  HorizontalBarSeries,
  XYPlot,
  XAxis,
  YAxis,
  Crosshair,
} from "react-vis";
import { descSort, ascSort } from "./utils";
import { sample1, sample2, sampleLabel } from "./sampleData";

const useStyles = makeStyles(theme => ({
  crosshair: {
    color: "white",
    backgroundColor: "black",
    width: 20,
    opacity: 0.7,
    paddingLeft: 10,
  },
}));

interface SamplePropsTypes {
  width: number;
  height: number;
}

interface DataTypes {
  x: number;
  y: number;
}

const SampleVis = (props: SamplePropsTypes) => {
  const classes = useStyles();
  const sampleLabel = ["R", "e", "a", "c", "t", "-", "A", "C"];

  const [crosshairValues, setCrosshairValues] = useState<any>({});
  const [data, setData] = useState<DataTypes[]>([]);
  const [isLabel, setLabel] = useState<boolean>(false);
  const [isSort, setSort] = useState<boolean>(false);
  const [labelList, setLabelList] = useState<string[]>([]);
  const [top, setTop] = useState<number>(0);
  const [yLabel, setYLabel] = useState<number | null>(null);

  const getData = (direction: string) => {
    if (direction === "vertical") {
      setData(sample1);
    } else if (direction === "horizontal") {
      setData(sample2);
    }
  };

  useEffect(() => {
    getData("horizontal");
  }, []);

  useEffect(() => {
    if (isLabel) {
      setLabelList(sampleLabel);
    } else {
      setLabelList([]);
    }
  }, [isLabel]);

  useEffect(() => {
    const tmpLabel = labelList.slice().reverse();
    if (isSort) {
      data.sort((a: any, b: any) => ascSort(a.x, b.x));
      data.map((val: any, index: number) => (val.y = index));
      setLabelList(tmpLabel);
    } else {
      data.sort((a: any, b: any) => descSort(a.x, b.x));
      data.map((val: any, index: number) => (val.y = index));
      setLabelList(tmpLabel);
    }
  }, [isSort]);

  const onMouseLeave = () => {
    setCrosshairValues({});
    setYLabel(null);
    setTop(0);
  };

  const onNearestX = (_value: any, { event, innerX, innerY, index }: any) => {
    console.log(`${innerY} | ${innerX} | ${index}`);
    setYLabel(index);
    setTop(event.offsetY);
    setCrosshairValues(data[index]);
  };

  return (
    <div>
      <Button onClick={() => setLabel(!isLabel)}>Change Label</Button>
      <Button onClick={() => setSort(!isSort)}>Change Sort</Button>
      {data.length > 0 ? (
        <XYPlot
          width={props.width}
          height={props.height}
          onMouseLeave={onMouseLeave}
        >
          <XAxis title="React Advent2" />
          <YAxis
            title="18th"
            tickFormat={v => {
              if (v > labelList.length) {
                return null;
              }
              return labelList[v];
            }}
          />
          <HorizontalBarSeries
            data={data}
            color="skyblue"
            onNearestXY={onNearestX}
          />
          {yLabel != null ? (
            <Crosshair values={[crosshairValues]}>
              <div
                className={classes.crosshair}
                style={{ position: "absolute", top: top - 30 }}
              >
                <p>{labelList[yLabel]}</p>
                <p>{data[yLabel].x}</p>
              </div>
            </Crosshair>
          ) : (
            <div />
          )}
        </XYPlot>
      ) : (
        ""
      )}
    </div>
  );
};
一気にパーツを増やしてしまいましたが、React Componentに慣れている方にはなかなか書きやすそうではないでしょうか?
これらの基本的なグラフ以外にも、様々なグラフ(散布図、面積図、ツリーマップ、ネットワーク、、)が用意されているので、描画に困ることはなさそうです。
今回は省略していますが、フィルターなどのインタラクティブな操作ロジックを組む部分は、Hooksなどのおかげでより書きやすいのではなかろうかと思っています。
おわりに
React-Visによるデータビジュアライズの簡単な紹介をさせて頂きました。
ライブラリの原則通り各パーツがReact Componentとしてexportされているので、JSX内のXyPlotに色々なコンポーネントを差し込んでいくことで、任意のパーツを組み込んだグラフが作れるのはとてもよいです。また、1つ1つのパーツに余計なものがついておらず、分離されており自由度が高いのもよいですね。逆にコードの記述量が増えがちというのはあるかも?そこはうまく汎化させていきたいところです。
ただ、ドキュメントでカバーされていない部分もたまにあり、カスタマイズする際にソースを読みにいかなければよく分からないこともあるのが玉に瑕ですが、React Componentとして設計されているので、把握しやすいといえば把握しやすいです。
Reactでデータの可視化を扱う際は、是非使ってみてください。
