AIが急速に発展している時代に、データアナリストの仕事は挑戦に直面しています。AIは効率的にコードを出力することができます。ビジネスニーズを深く理解し、「ビジネス向け開発者」になるだけでなく、データアナリストは可視化の方向にも、美的感覚を高める努力をすることができます。AIはまだ複雑で美しい可視化画像を出力する能力はありません。
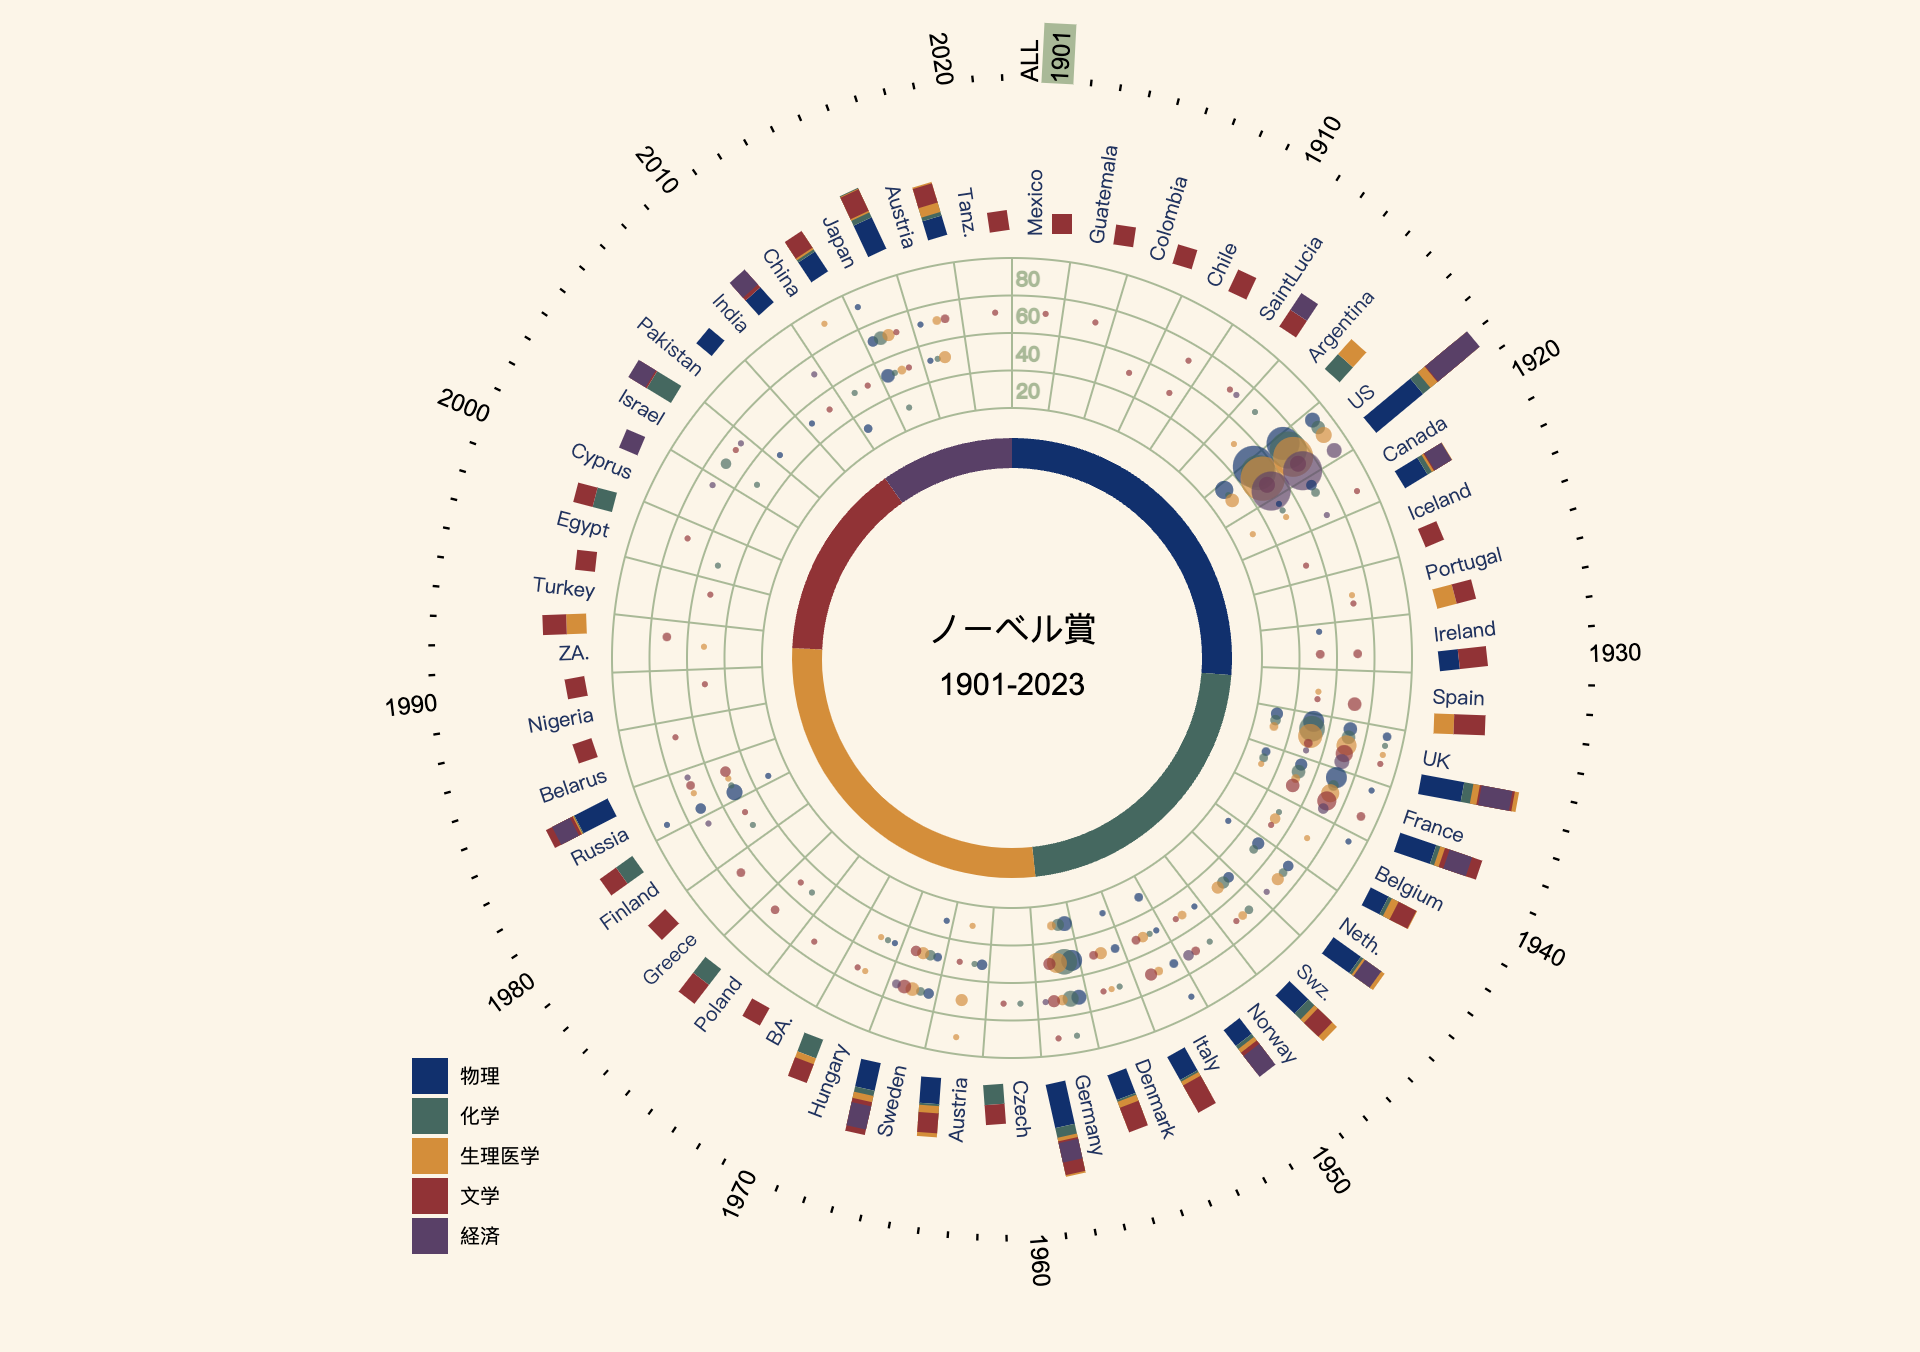
以下の図は、1901年から2023年までのノーベル賞の100年間の受賞状況を可視化したものです。主に、受賞者の当時の国籍、専門分野、受賞者の年齢の可視化です。選択した可視化図形はアスタープロットです。また、画像の背景と専門分野の色は、日本の伝統色を採用しています。例えば、ENJI 燕脂、SEIHEKI青碧など。
この1枚の図から、各国の受賞数の比較、学科の傾向、40-80歳の間の受賞者数が最も多いなどの情報が簡単に見えます。これは、フロントエンドのデータ可視化がPOWERBIの可視化に比べて優れている点であり、より高度な創造性を持ち、AIに取って代わることは難しいです。
データソース:https://www.nobelprize.org/prizes/lists/all-nobel-prizes/
- 以下は 可視化.js 主要なコードロジックです:
1. 円形の各種パラメータを設定
const width = 640;

let dimensions = {
  width: width,
  height: width,
  radius: width / 2,
  pieInnerRadius: 95,
  pieOuterRadius: 110,
  ageInnerRadius: 125,
  ageOuterRadius: 200,
  countryBarRadius: 216,
  yearRadius: 216 + 62,
};
2.円心を設定
const bounds = d3
  .select("#wrapper")
  .append("svg")
  .attr(
    "viewBox",
    `${-dimensions.width / 2} ${-dimensions.height / 2} ${dimensions.width} ${
      dimensions.height
    }`
  )
  .attr("width", dimensions.width)
  .attr("height", dimensions.height)
  .append("g");
3.パイチャートを作成
function drawPieChart() {
  const arc = d3
    .arc()
    .innerRadius(dimensions.pieInnerRadius)
    .outerRadius(dimensions.pieOuterRadius);

  const pie = d3.pie().sort(null);

  const allPath = bounds
    .selectAll("path")
    // [201, 169, 210, 111, 75, 0, 0]
    .data(pie(secondPieData[115]))
    .enter()
    .append("path")
    .attr("d", arc)
    .attr("fill", (d, i) => {
      if (i == 5) return "#5c5c5c";
      if (i == 6) return "#FFFFFF";
      return nobelDotColor[i];
    });
}

drawPieChart();
4.軸線を作成
const axis = bounds.append("g").attr("class", "grid-line");

function drawAxis() {
  d3.range(5).map((i) => {
    const cr =
      dimensions.ageInnerRadius +
      (i * (dimensions.ageOuterRadius - dimensions.ageInnerRadius)) / 4;
    axis.append("circle").attr("r", cr);

    axis
      .append("text")
      .attr("y", -cr)
      .attr("dx", ".2em")
      .attr("dy", "-.5em")
      .text(i != 4 ? (i + 1) * 20 : "");
  });

  countryList.map((country, i) => {
    const [x1, y1] = getCoordinatesForAngle(
      countryScale(i),
      dimensions.ageInnerRadius
    );
    const [x2, y2] = getCoordinatesForAngle(
      countryScale(i),
      dimensions.ageOuterRadius
    );

    axis
      .append("line")
      .attr("class", "grid-line")
      .attr("x1", x1)
      .attr("y1", y1)
      .attr("x2", x2)
      .attr("y2", y2);
  });
}
drawAxis();
5.国名
const countryScale = d3
  .scaleLinear()
  .domain([0, countryList.length])
  .range([0, Math.PI * 2]);

const getCoordinatesForAngle = (angle, radius) => [
  Math.cos(angle - Math.PI / 2) * radius,
  Math.sin(angle - Math.PI / 2) * radius,
];
function drawCountry() {
  countryList.map((country, i) => {
    const [x, y] = getCoordinatesForAngle(
      countryScale(i),
      dimensions.countryBarRadius
    );

    const countryGroup = bounds.append("g").attr(
      "transform",
      `rotate(${(countryScale(i) * 180) / Math.PI - 90}) translate(${
        dimensions.countryBarRadius - 5
      }, 0)`
    );

    countryGroup
      .append("text")
      .text(country)
      .attr("fill", "#a29bfe")
      .style("text-anchor", (d) =>
        countryScale(i) < Math.PI ? "start" : "end"
      )
      .attr("transform", (d) =>
        countryScale(i) < Math.PI
          ? "translate(0, 15)"
          : "rotate(-180) translate(0,-7)"
      );
  });
  }

drawCountry();
6.国と科目の積み上げ棒グラフを描く
let countryPrize = personCountPerYP[123];
let new_countryPrize = [];
const keys = ["物理", "化学", "生理医学", "文学", "経済"];

countryPrize.forEach((arr, i) => {
  const new_item = {};
  arr.forEach((item, j) => {
    new_item[keys[j]] = item;
  });
  new_item["sum"] = d3.sum(arr);
  new_countryPrize.push(new_item);
});

const stackedData = d3.stack().keys(keys)(new_countryPrize);

function drawCountryPrizeBarChart() {
  const stackBar = bounds
    .append("g")
    .selectAll("g")
    .data(stackedData)
    .join("g")
    .attr("fill", (d, idx) => nobelDotColor[idx]);

  stackBar
    .selectAll("rect")
    .data((d) => d)
    .join("rect")
    .attr(
      "transform",
      (d, i) =>
        `rotate(${(countryScale(i) * 180) / Math.PI - 90}) translate(${
          dimensions.countryBarRadius - 4
        }, 20)`
    )
    .attr("x", (d) => Math.sqrt(Math.sqrt(d[0])) * 10)
    .attr("height", 10)
    .attr("width", (d) => Math.sqrt(Math.sqrt(d[1] - d[0])) * 10);
}
drawCountryPrizeBarChart();
7.国-年齢-科目の散布図
function drawEachPrizeCircle() {
  d3.range(countryList.length).map((iAll) => {
    d3.range(5).map((jAll) => {
      d3.range(5).map((kAll) => {
        const angle =
          countryScale(iAll) +
          ((kAll + 1) * ((2 * Math.PI) / countryList.length)) / 6;
        const age = 10 + jAll * 20;
        const personAgeToPoint = 90 - ((age - 20) / 80) * 75;
        const radius = dimensions.countryBarRadius - personAgeToPoint;
        const [x, y] = getCoordinatesForAngle(angle, radius);

        bounds
          .selectAll(`.AllPerson${iAll}`)
          .data(nbAllPerson[iAll][jAll])
          .join("circle")
          .attr("class", `allPersonPoints_${iAll}_${jAll}_${kAll}`)
          .attr("fill-opacity", 0.2)
          .attr("fill", nobelDotColor[kAll])
          .attr("cx", x)
          .attr("cy", y)
          .attr("r", 1.5 * Math.sqrt(nbAllPerson[iAll][jAll][kAll]));
      });
    });
  });
}

drawEachPrizeCircle();
8.外側の年度目盛り
  function drawYear() {
    const yearRange = 123;
    const yearScale = d3
      .scaleLinear()
      .domain([0, yearRange])
      .range([0, 2 * Math.PI]);
    d3.range(yearRange).map((year) => {
      const [x, y] = getCoordinatesForAngle(
        yearScale(year),
        dimensions.yearRadius
      );

      const yearGroup = bounds
        .append("g")
        .attr(
          "transform",
          `rotate(${(yearScale(year) * 180) / Math.PI - 90}) translate(${
            dimensions.yearRadius + 10
          }, 0)`
        );
      const rect = yearGroup
        .append("rect")
        .attr("class", "perYearButton_" + year)
        .attr("id", "" + year)
        .attr("width", 30)
        .attr("height", 16)
        .attr("fill", "#A5BA93")
        .attr("fill-opacity", year == 0 ? 1 : 0)
        .attr("cursor", "pointer");

      yearGroup
        .append("text")
        .text(year == 0 ? "ALL" : year % 10 == 0 ? 1900 + year : "-")
        .attr("dy", "1.1em")
        .attr("class", "timeText_" + year)
        .attr("fill", "#000000")
        .attr("font-size", 12)
        .attr("font-family", "Arial")
        .attr("fill-opacity", 1)
        .attr("cursor", "pointer")
        .attr("pointer-events", "none")
        .attr("text-anchor", (d) =>
          yearScale(year) < Math.PI ? "start" : "end"
        )
        .attr("transform", (d) =>
          yearScale(year) < Math.PI
            ? "rotate(0)"
            : "rotate(-180) translate(0, -20)"
        );

      rect
        .on("mouseover", function () {
          d3.select(this).transition().duration(100).attr("fill-opacity", 1);

          d3.select(".timeText_" + d3.select(this).attr("id"))
            .transition()
            .duration(100)
            .text(year == 0 ? "ALL" : 1900 + year)
            .attr("fill-opacity", 1);
        })
        .on("mouseout", function () {
          d3.select(this).transition().duration(500).attr("fill-opacity", 0);

          d3.select(".timeText_" + d3.select(this).attr("id"))
            .transition()
            .duration(100)
            // .attr("fill-opacity", 0);
            .text(year == 0 ? "ALL" : year % 10 == 0 ? 1900 + year : "-");
        });
    });
  }

  drawYear();