Rコマンドの自分用メモ
よく使うけどすぐに忘れるので1カ所にまとめました。
分類はしてない・・・。
Rstudio利用時にハマる
windowsにて日本語のユーザ名をつけてしまうと、plotで下記のエラーが出てしまいうまくいかない
マルチバイトがpathに含まれるとだめみたいね。
下記のerror「????」部分が日本語名
■参考
https://support.rstudio.com/hc/en-us/community/posts/203375017-problem-with-plot-function
Error in gzfile(file, "wb") : cannot open the connection
In addition: Warning message:
In gzfile(file, "wb") :
 cannot open compressed file 'C:/Users/gg?????/AppData/Local/Temp/Rtmpmeb5xH/rs-graphics-14c77d2b-9f7c-488b-b973-919a54ddb614/f7674257-dbf7-4401-a5b1-298b42eebb00.snapshot', probable reason 'Invalid argument'
Graphics error: Plot rendering error
コマンド一覧
ワーキングディレクトリを知りたい!
getwd()
getwd()
[1] "/Users/hirudai/Documents/rwork/yasaR"
ワーキングディレクトリを変えたい!
setwd("path")
setwd("../")
getwd()
[1] "/Users/hirudai/Documents/rwork"
定義した変数、オブジェクトを全部削除したい
rm(list=ls())
ファイル読みたい!
CSVファイルの場合
read.csv("file_path")
タブ区切りの場合
read.delim("file_path")
read.csv("tes.csv")
    name height weight
1 bababa    179     70
2 gagaga    140     50
3    vsi    250    120
データフレームの一部を抜き出したい
[data_frame_name]$[カラム名]
または
[data_frame_name][,n]
[data_frame_name][n,]
hoikujo <- read.csv("hoikujo_ichiritu_2014.csv")
hoikujo$実人数
 [1]  73  65 110  92  83 103  59  98  53  44  62  26  30   7   0  65  60  66  45  54 109  45   4
[24]  18  34   6
データフレームの型を調べたい
sapply([data_frame_name],class)
hoikujo <- read.csv("hoikujo_ichiritu_2014.csv")
sapply(hoikujo,class)
       NO      区分      名称  解説年月      定員    実人数    職員数
"integer"  "factor"  "factor"  "factor" "integer" "integer" "integer"
データフレームから特定条件を満たすデータを取得したい
subset(データフレーム名,条件)
subset(hoiku,定員>300)
ヒストグラムを書きたい
hist([数値ベクトル])
hist(hoikujo$実人数)
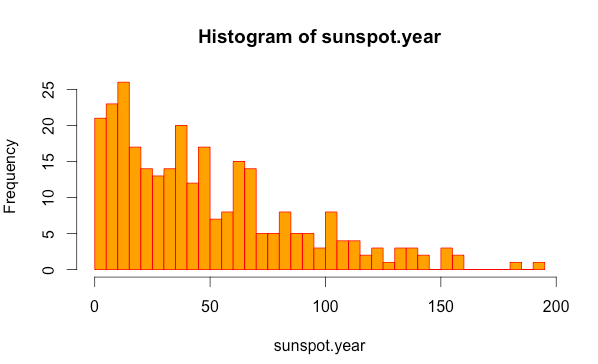
hist(sunspot.year,breaks=50, col = "orange", border="red")
度数分布表のためのデータを得る
hist(sunspot.year,plot=F)
$breaks
 [1]   0  20  40  60  80 100 120 140 160 180 200

$counts
 [1] 87 61 44 39 21 18 10  7  0  2

$density
 [1] 0.0150519031 0.0105536332 0.0076124567 0.0067474048 0.0036332180 0.0031141869 0.0017301038
 [8] 0.0012110727 0.0000000000 0.0003460208

$mids
 [1]  10  30  50  70  90 110 130 150 170 190

$xname
[1] "sunspot.year"

$equidist
[1] TRUE

attr(,"class")
[1] "histogram"
出力結果を抜粋して、意味は以下の通り
| 変数名 | 意味 |
|---|---|
| $breaks | 階級の区切り |
| $counts | 度数 |
| $mid | 階級値 |
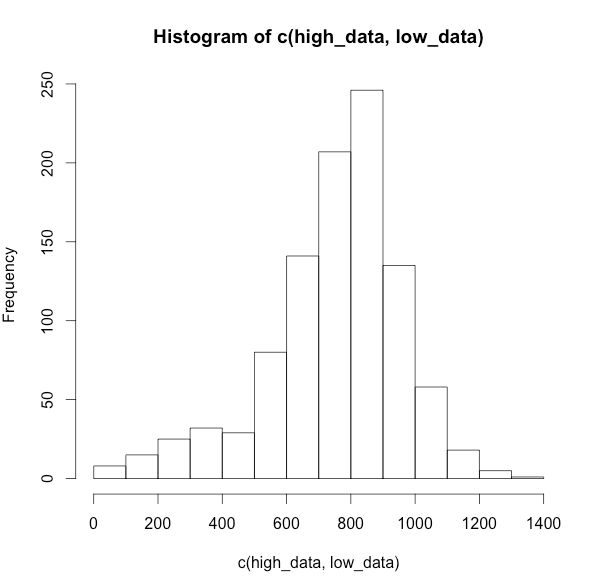
ヒストグラムが左に歪むデータを作成
# 900個のサンプルデータを値高めの800で
high_data <- abs(rnorm(900,800,150))
# 100個のサンプルデータを値低めの300で
low_data <- abs(rnorm(100,300,150))
# データ結合してヒストグラムを書く
hist(c(high_data, low_data))
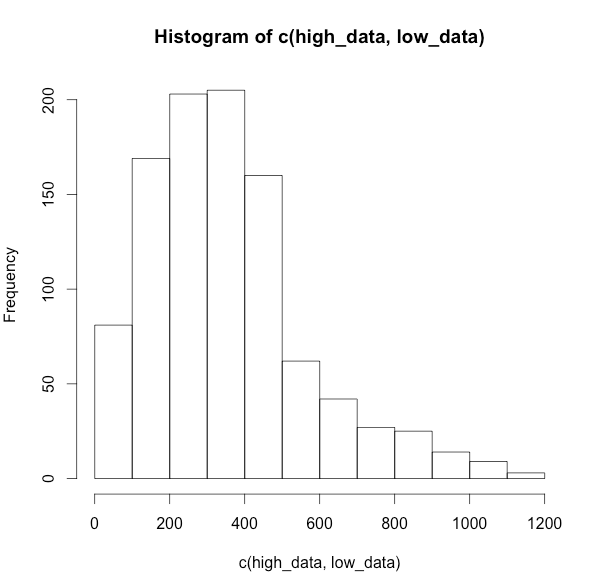
ヒストグラムが右に歪むデータを作成
# 100個のサンプルデータを値高めの800で
high_data <- abs(rnorm(100,800,150))
# 900個のサンプルデータを値低めの300で
low_data <- abs(rnorm(900,300,150))
# データ結合してヒストグラムを書く
hist(c(high_data, low_data))
一様な分布をつくる
runif関数をつかって395から405の間でほぼ一様な分布を作る
uniform_data <- as.integer(runif(1000,395,405))
hist(uniform_data)
集合の平均、中央値、最小、最大、第1、3四分位点を取得する
summary[ベクトル]
summary(iris[1])
  Sepal.Length
 Min.   :4.300
 1st Qu.:5.100
 Median :5.800
 Mean   :5.843
 3rd Qu.:6.400
 Max.   :7.900


