Pythonで表示したグラフにマウスオーバーした時,最近傍点の値を表示する
matplotlibで表示したグラフにマウスを持ってきた時,最も近い点の値を表示させたい.
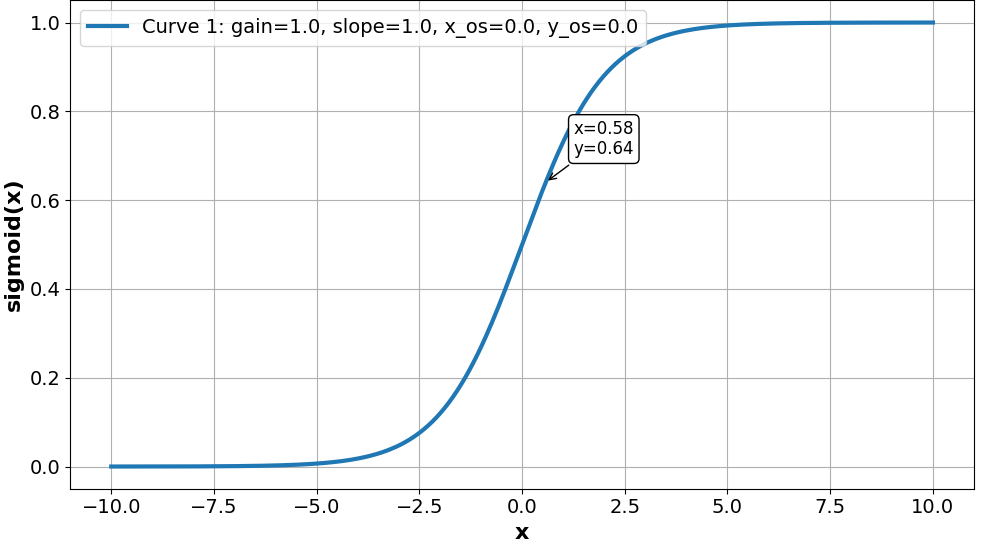
このようにマウスカーソル近傍のx,y値を表示するPythonスクリプトのサンプルを以下に示します.
<操作手順>
1.下記のPythonコードを任意のディレクトリに保存
2.コマンドプロンプトにて,そのディレクトリに移動
3.コマンドプロンプトで実行:python sigmoid_dialog2_dispXY.py
4.表示されたダイアログにそって,係数を入力(この場合は,シグモイド関数プロットの例)
5.グラフが表示されるので,任意カーブ上にマウスカーソルを持っていく
6.上図のように近傍点のx,y値を表示
sigmoid_dialog2_dispXY.py
import numpy as np
import matplotlib.pyplot as plt
import tkinter as tk
from tkinter import simpledialog

# シグモイド関数の定義(パラメータ付き)
def sigmoid(x, gain=1, slope=1, x_os=0, y_os=0):
    return gain / (1 + np.exp(-slope * (x - x_os))) + y_os

# ダイアログでパラメータを取得
def get_parameters():
    root = tk.Tk()
    root.withdraw()  # メインウィンドウを非表示

    curves = []
    num_curves = simpledialog.askinteger("入力", "プロットするシグモイド曲線の数を入力してください:")

    for i in range(num_curves):
        gain = simpledialog.askfloat(f"Curve {i+1}", "ゲイン(gain)を入力してください:", initialvalue=1.0)
        slope = simpledialog.askfloat(f"Curve {i+1}", "傾き(slope)を入力してください:", initialvalue=1.0)
        x_os = simpledialog.askfloat(f"Curve {i+1}", "Xオフセット(x_os)を入力してください:", initialvalue=0.0)
        y_os = simpledialog.askfloat(f"Curve {i+1}", "Yオフセット(y_os)を入力してください:", initialvalue=0.0)
        curves.append((gain, slope, x_os, y_os))

    return curves

# メイン処理
def plot_sigmoid_curves():
    x = np.linspace(-10, 10, 400)
    curves = get_parameters()

    fig, ax = plt.subplots(figsize=(10, 6))
    lines = []

    for i, (gain, slope, x_os, y_os) in enumerate(curves):
        y = sigmoid(x, gain, slope, x_os, y_os)
        line, = ax.plot(x, y, label=f'Curve {i+1}: gain={gain}, slope={slope}, x_os={x_os}, y_os={y_os}', linewidth=3)
        lines.append((x, y))

    # フォントサイズの調整
    ax.set_title('Multiple Sigmoid Curves', fontsize=18, fontweight='bold')
    ax.set_xlabel('x', fontsize=16, fontweight='bold')
    ax.set_ylabel('sigmoid(x)', fontsize=16, fontweight='bold')
    ax.tick_params(axis='both', labelsize=14)
    ax.grid(True)
    ax.legend(fontsize=14, loc='upper left')

    # 注釈の準備
    annotation = ax.annotate("", xy=(0, 0), xytext=(20, 20),
                             textcoords="offset points", fontsize=12,
                             bbox=dict(boxstyle="round", fc="w"),
                             arrowprops=dict(arrowstyle="->"))
    annotation.set_visible(False)

    # マウスイベント処理
    def on_mouse_move(event):
        if not event.inaxes:
            annotation.set_visible(False)
            fig.canvas.draw_idle()
            return

        min_dist = float('inf')
        closest_x, closest_y = None, None

        for x_data, y_data in lines:
            idx = np.argmin(np.abs(x_data - event.xdata))
            x_val = x_data[idx]
            y_val = y_data[idx]
            dist = np.hypot(x_val - event.xdata, y_val - event.ydata)
            if dist < min_dist:
                min_dist = dist
                closest_x, closest_y = x_val, y_val

        if min_dist < 0.5:  # しきい値 調整可能
            annotation.xy = (closest_x, closest_y)
            annotation.set_text(f"x={closest_x:.2f}\ny={closest_y:.2f}")
            annotation.set_visible(True)
        else:
            annotation.set_visible(False)

        fig.canvas.draw_idle()

    fig.canvas.mpl_connect("motion_notify_event", on_mouse_move)
    plt.tight_layout()
    plt.show()

plot_sigmoid_curves()