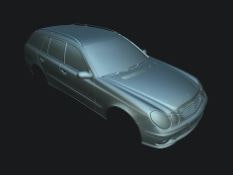
iPad ProのLiDAR(3Dスキャナー)で取得した点群データをPythonで表示する
1.取得した点群ファイルを準備
ここでは,Artec 3Dサイトから無料ダウンロードさせて頂いたCar body.plyファイルを例に挙げる.

2.任意のフォルダに,点群ファイルをコピーして,下記のPythonを実行する.
<ポイント>
・ダイアログボックスで,.plyファイルが選択できる
・読み込んだ点群データの頂点数と面の数を表示
・mesh.show()では表示できなかったので,matplotlibライブラリで表示するようにした
plot_ply.py
import trimesh
import os
import tkinter as tk
from tkinter import filedialog
import matplotlib.pyplot as plt

# ダイアログボックスでPLYファイルを選択
root = tk.Tk()
root.withdraw()
file_path = filedialog.askopenfilename(filetypes=[("PLY files", "*.ply")])

# PLYファイルの読み込み
mesh = trimesh.load(file_path)

# メッシュ情報の表示
print(mesh)
print("頂点数:", len(mesh.vertices))
print("面の数:", len(mesh.faces))

# PLYメッシュの表示
# mesh.show()

# 3Dプロットの準備
fig = plt.figure()
ax = fig.add_subplot(111, projection='3d')

# 点群のプロット
ax.scatter(mesh.vertices[:, 0], mesh.vertices[:, 1], mesh.vertices[:, 2], s=0.1)

plt.show()
ちなみに,マウスドラッグで回転できます.
Trimeshライブラリのバージョンでエラーが出る時の対処
インストールされているtrimeshをアンインストール
bash
pip uninstall trimesh
バージョンを指定してtrimeshを再インストール
bash
pip install trimesh==1.8.5
インストールされたバージョンを確認する
bash
import trimesh
print(trimesh.__version__)
