Seaborn(Pythonパッケージ)の3Dプロット
Excelの3次元グラフ機能がもっと充実していればいいのに...
3次元の離散値をPytnonでプロットするサンプルプログラムを示します.
以下のPythonスクリプトを実行すると,
別ウィンドウにて表示され,マウスで回転・拡大縮小ができる.
seaborn_sample.py
import seaborn as sns
import matplotlib.pyplot as plt
import numpy as np
from mpl_toolkits.mplot3d import Axes3D
# Seabornスタイルを適用
sns.set(style="darkgrid")
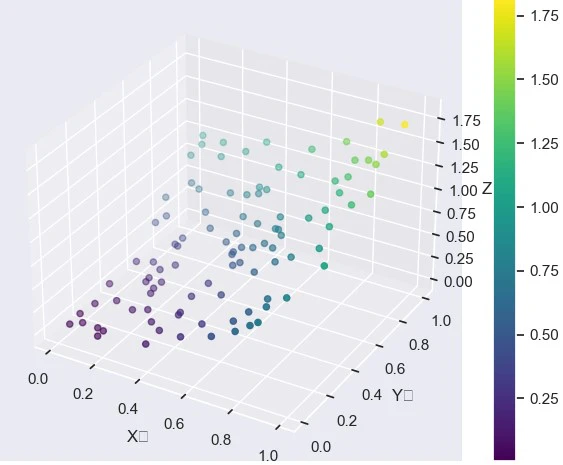
# データ生成
x = np.random.rand(100)
y = np.random.rand(100)
z = x**2 + y**2
# 3Dプロットの作成
fig = plt.figure(figsize=(8, 6))
ax = fig.add_subplot(111, projection='3d')
sc = ax.scatter(x, y, z, c=z, cmap='viridis', marker='o')
# 軸ラベルとタイトル
ax.set_xlabel('X軸')
ax.set_ylabel('Y軸')
ax.set_zlabel('Z軸')
plt.title('Seabornスタイルの3D散布図')
plt.colorbar(sc)
plt.show()