はじめに
棒グラフをPythonにより描写し,peakが何個存在するかを自動カウントするプログラムを作成したい
前提
今回求めたいpeakを説明する.
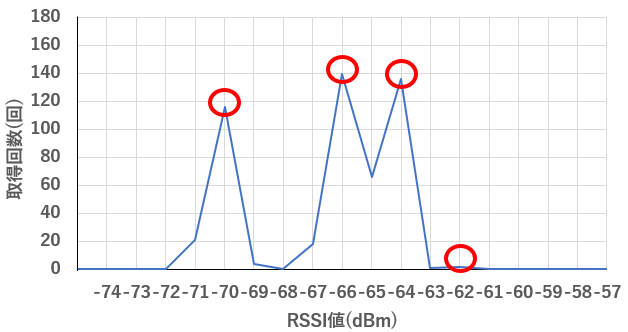
peakとは山頂,山,先端などを表し,図の赤い丸の部分のことを言う.
RSSI値(dBm)をx軸の左側から順にみていき,現在の値が一つ前の値よりも大きいかつ,現在の値が1つ次の値よりも大きい時,peakとしている.

使用したデータ
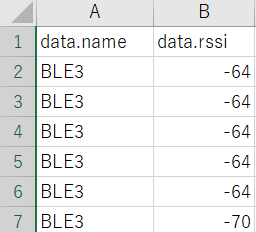
研究で使用しているBLEのRSSIデータの一部抜粋である.今回は504個のデータを使用する.
環境
実装
peak.py
def peak(data_path):
    import numpy as np
    import matplotlib.pyplot as plt
    import seaborn as sns
    import csv
    from statistics import variance

    rssi = []

    #csvファイルを読み込む
    with open(data_path) as f:
        reader = csv.reader(f)
        data = [row for row in reader]

    for i in data:
        try:
            rssi.append(int(i[1]))
        except:
            pass

    min_rssi = min(rssi)
    max_rssi = max(rssi)

    #RSSIの最小値と最大値の範囲を出力
    print("{}<=RSSI<={}".format(min_rssi,max_rssi))

    plt.figure(figsize=(8,6))

    #山の数をカウントする
    count=0
    for i in range(min_rssi,max_rssi+1):
        #棒グラフの描写
        plt.bar(i, rssi.count(i), color="blue")
        if rssi.count(i) > rssi.count(i-1):
            if rssi.count(i) > rssi.count(i+1):
                count+=1
            else:
                count+=0
        elif rssi.count(i)>0:
            if rssi.count(i) == rssi.count(i-1):
                if rssi.count(i) > rssi.count(i+1):
                    count+=1
                else:
                    count+=0
        else:
            count+=0
        #print(rssi.count(i))
    print(f"山の数は{count}")
    print(f"分散は{variance(rssi)}")

    #グラフの範囲と書式設定
    plt.xlim(min_rssi, max_rssi)

    plt.ylabel('取得回数(回)', fontfamily='Meiryo', fontsize=18)
    plt.xlabel('RSSI(dBm)', fontfamily='Meiryo', fontsize=18)
    plt.show()

    return (f"{data_path}の山の数は{count}")
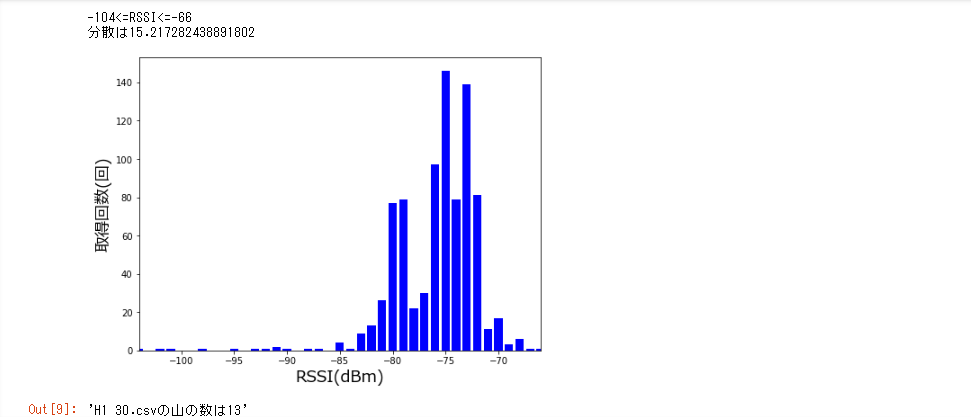
実行結果
データから棒グラフを描写し,peakを特定することが出来ました.
まとめ
Pythonによるpeak検出ができました.研究頑張ります.


