やったこと
三角関数について調べる機会があったので、もっと何かできないかと思い、三角比を考えるときによく出てくる図を描画する処理をpythonで書いてみました。
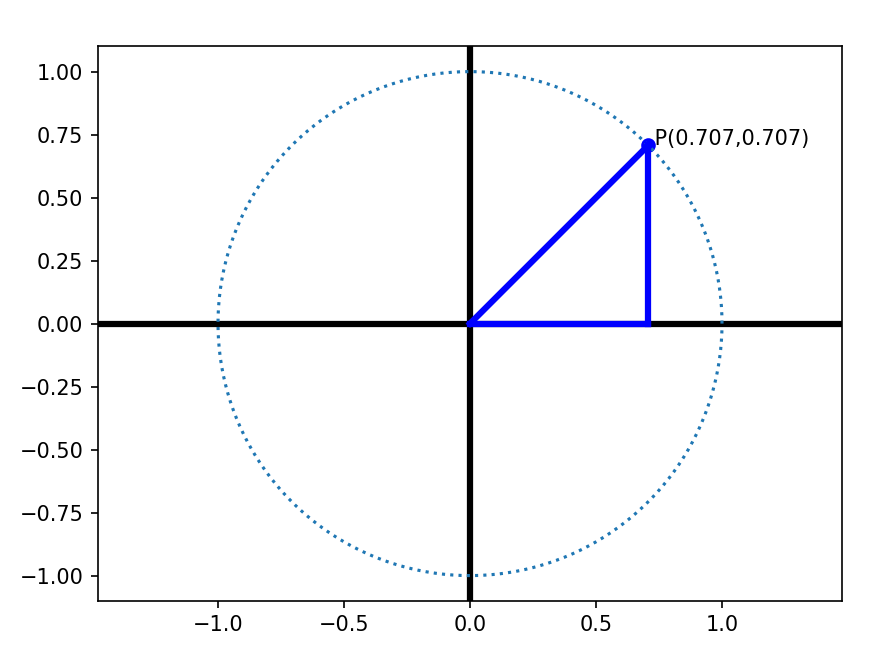
triangle_drow()に角度を渡してやると図を書いて、座標の情報を表示してくれます。
# coding: utf-8
import matplotlib.pyplot as plt
import numpy as np

# 三角比を図に描画
def triangle_drow(angle):
    #X座標とY座標を算出
    x1 = np.cos(np.radians(angle))
    y1 = np.sin(np.radians(angle))

    #円の上に点Pをプロットして座標を表示
    plt.scatter(x1,y1,color="blue")
    target_text = " P(" + str(round(x1,3)) + "," + str(round(y1,3)) + ")"
    plt.text(x1,y1,target_text)

    #点Pを使って三角形を作成
    plt.plot([0,x1],[0,y1],linewidth=3,color="blue")
    plt.plot([x1,x1],[0,y1],linewidth=3,color="blue")
    plt.plot([0,x1],[0,0],linewidth=3,color="blue")

# メイン処理
# 軸の描写
plt.axhline(0, linewidth=3, color="black")
plt.axvline(0, linewidth=3, color="black")

# 円の描写
angle = np.arange(0,360) #0~360の角度のリストを作成
circle_x = np.cos(np.radians(angle)) #x座標のリスト
circle_y = np.sin(np.radians(angle)) #y座標のリスト
plt.plot(circle_x,circle_y, linestyle="dotted")

# 引数で渡した角度の三角形を描画
triangle_drow(45)

plt.axis('equal') #x軸とy軸のスケールを揃える
plt.show()
出力結果