はじめに
この記事は、plotnine のテーマ紹介です。
plotnineは様々なテーマ設定が可能です。
設定は簡単なので、気に入ったテーマがあればぜひ。
実行条件など
-Google colabで実行
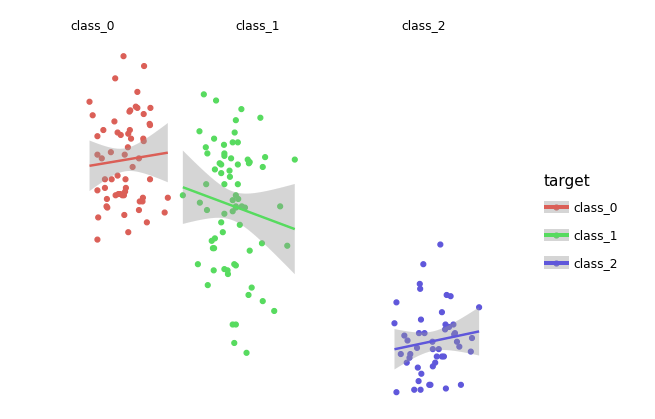
-前回の記事で描いた、ワインの種類別散布図(直線回帰付き)をテーマ別に描きます。
実行
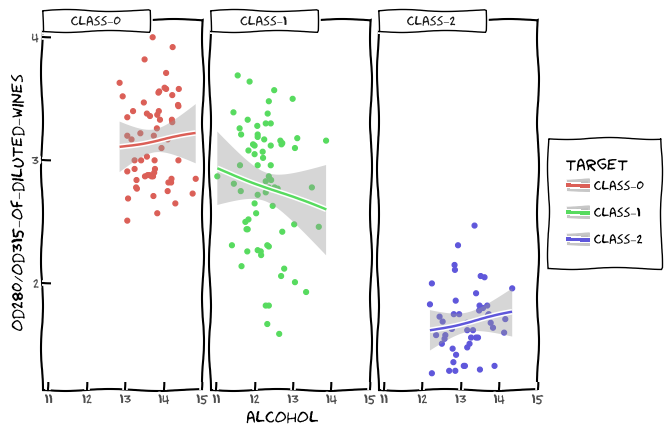
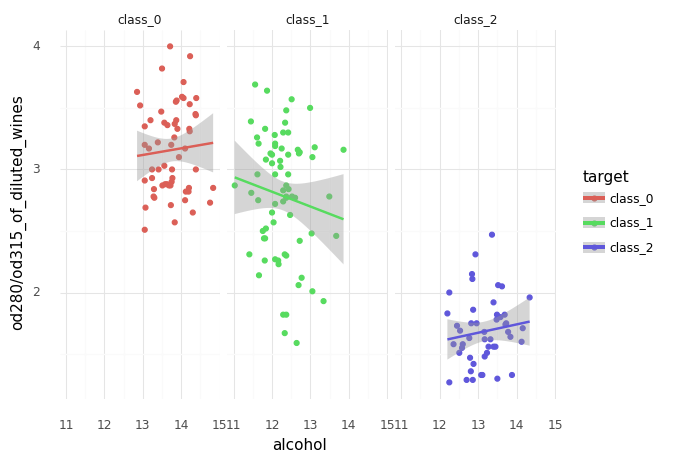
まずはplotnineデフォルトテーマです。

xkcd
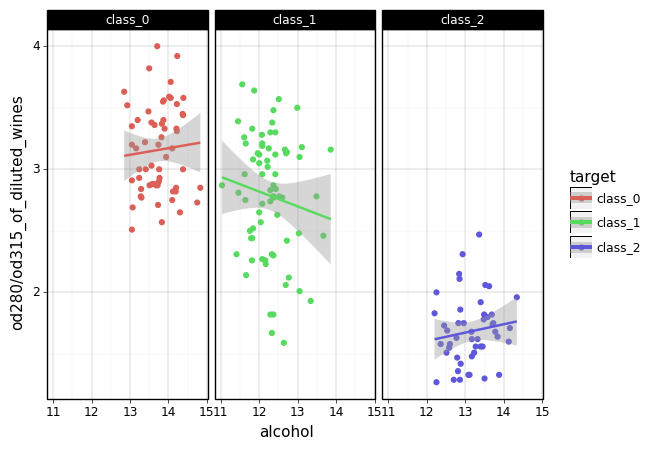
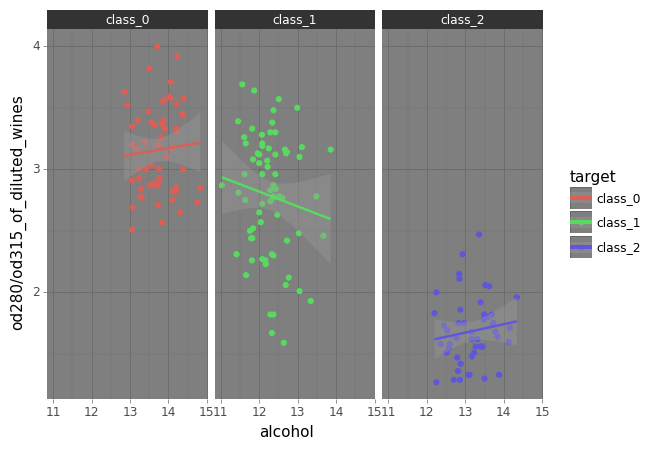
seaborn
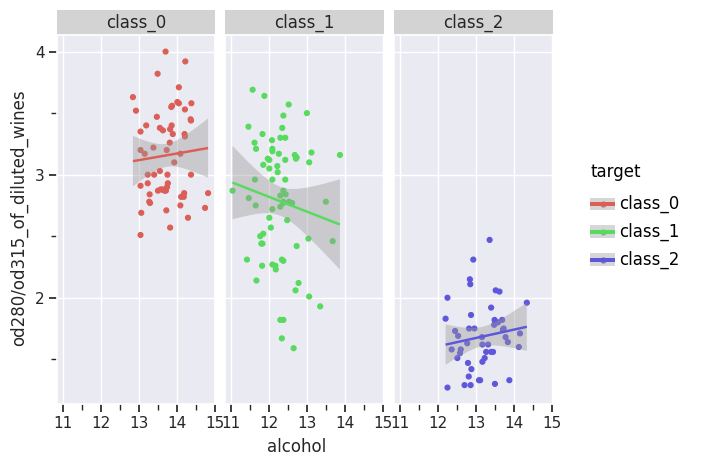
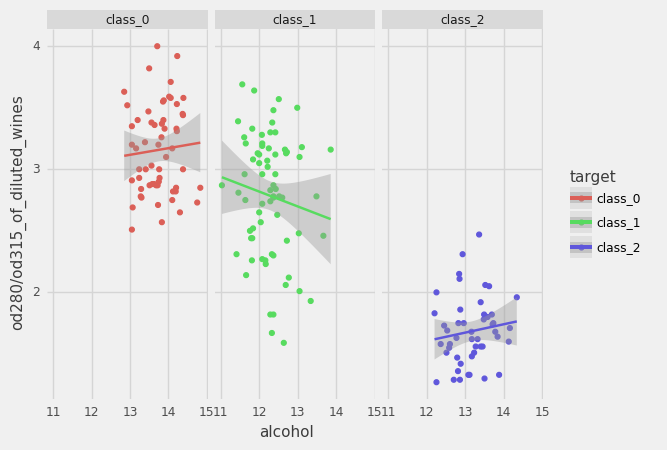
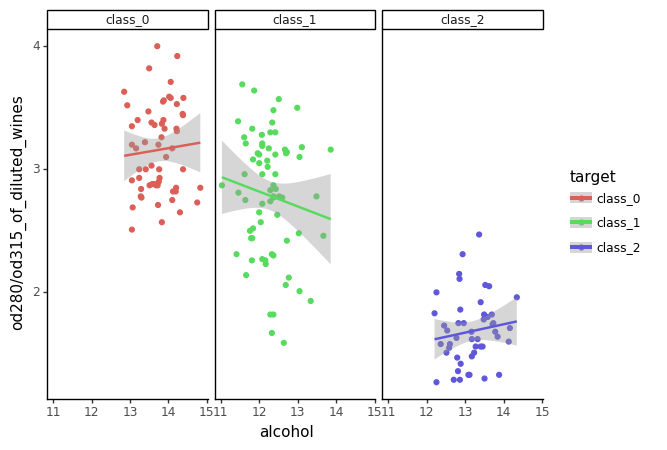
light
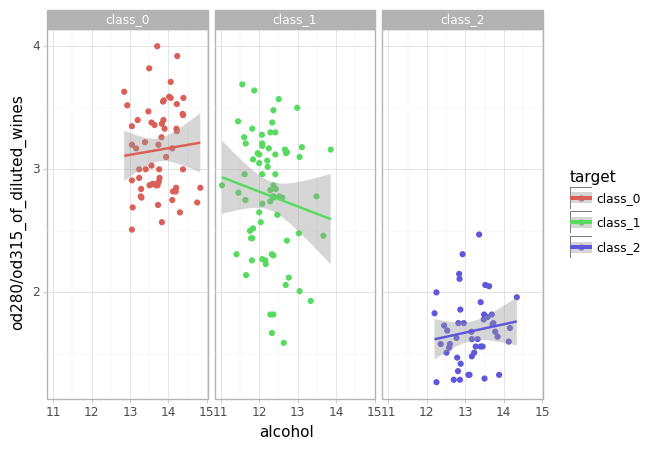
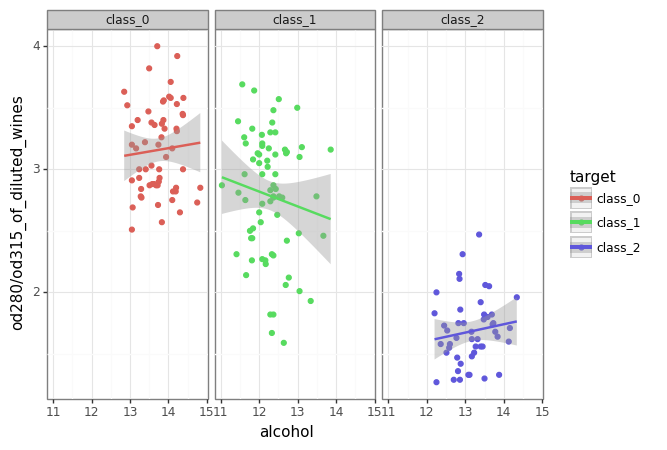
minimal
linedraw
538
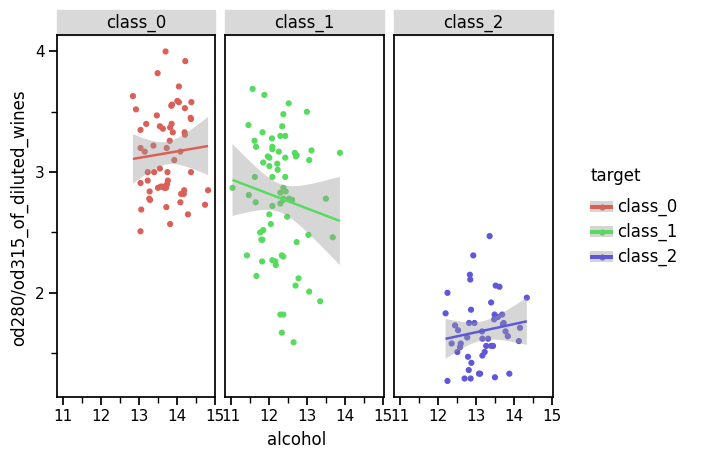
bw
dark
classic
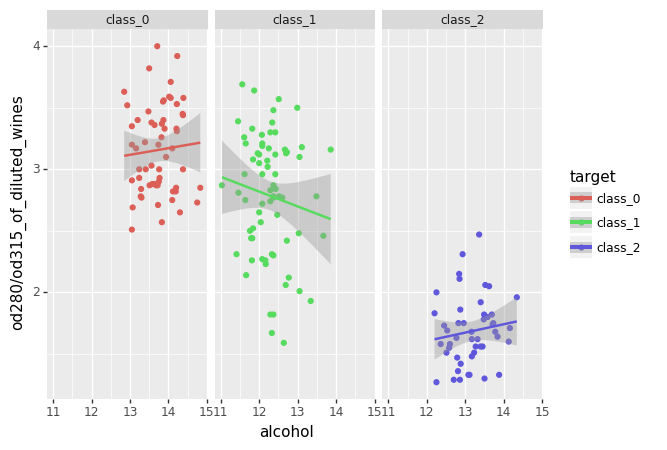
gray
matplotlib
void
実行コード
実行に必要なコードは、前回の記事 を確認してください。
以下、テーマ変更に関するコードのみを記述します。
最終行の + theme_**** を任意書き換えるだけです。
クラス毎に直線回帰付き散布図
#@title Scatter-plot for each target variable with linear regression(theme***)

X_column_name =  'alcohol'#@param {type:"raw"}
y_column_name =  'od280/od315_of_diluted_wines'#@param {type:"raw"}

(ggplot(df, aes(x=X_column_name, y=y_column_name, color = TARGET))
 + geom_point()
 + stat_smooth(method='lm')
 + facet_wrap(TARGET)
 + theme_xkcd())  #theme_seaborn,theme_light,theme_minimal,theme_linedraw,theme_538,theme_bw,theme_dark,theme_gray,theme_classic,theme_matplotlib,theme_void
最後に
テーマがいろいろ変更できるのはおもしろいですね。
seaborn と matplotlib が選べるというのは・・・何ともいえませんが。
参考