はじめに
ディープラーニング初心者がchainerでsin関数を学習させてみました。
初心者レベルとしては深層学習を読んで少し分かった気になったももの、いざこの記事を書こうと思ったら自分の理解度の低さに絶望を感じれるようになった程度です。
sin関数の学習はyuukiclassさんならび他でも多数やられていますが悪しからず。
環境
- python: 2.7.6
- chainer: 1.8.0
学習内容
0~2πまでの角度(theta)からsin(theta)を学習
[training data]
- input: theta(0~2π, 1000分割)
- output: sin(theta)
実装
ミニバッチ学習
ミニバッチ学習の実装箇所です。MNISTのサンプルなどでお馴染みのコードです(rangeなど一部変更)。
このミニバッチ学習が流行りらしいです。
perm = np.random.permutation(N)
sum_loss = 0
for i in range(0, N, batchsize):
    x_batch = x_train[perm[i:i + batchsize]]
    y_batch = y_train[perm[i:i + batchsize]]

    model.zerograds()
    loss = model(x_batch,y_batch)
    sum_loss += loss.data * batchsize
    loss.backward()
    optimizer.update()
学習データ & テスト
テスト時に使用する角度を学習時とは別にするためにデータ数を変更しています。
学習時は0〜2πを1,000分割、テスト時は0〜2πを900分割することにより角度を変更しています。
# 学習データ
N = 1000
x_train, y_train = get_dataset(N)

# テストデータ
N_test = 900
x_test, y_test = get_dataset(N_test)

'''
省略
'''
    # test
    loss = model(x_test,y_test)
    test_losses.append(loss.data)
学習パラメータ
-
ミニバッチサイズ(batchsize): 10
-
エポック(n_epoch): 500
-
隠れ層の数: 2
-
隠れ層のユニット数(n_units): 100
-
活性化関数: 正規化線形関数(relu)
-
ドロップアウト(dropout): なし(0%)
-
最適化: Adam
-
損失誤差関数: 平均二乗誤差関数(mean_squared_error)
パラメータは全て適当。
コード全体
# -*- coding: utf-8 -*-

# とりあえず片っ端からimport
import numpy as np
import chainer
from chainer import cuda, Function, gradient_check, Variable, optimizers, serializers, utils
from chainer import Link, Chain, ChainList
import chainer.functions as F
import chainer.links as L
import time
from matplotlib import pyplot as plt

# データ
def get_dataset(N):
    x = np.linspace(0, 2 * np.pi, N)
    y = np.sin(x)
    return x, y

# ニューラルネットワーク
class MyChain(Chain):
    def __init__(self, n_units=10):
        super(MyChain, self).__init__(
             l1=L.Linear(1, n_units),
             l2=L.Linear(n_units, n_units),
             l3=L.Linear(n_units, 1))

    def __call__(self, x_data, y_data):
        x = Variable(x_data.astype(np.float32).reshape(len(x_data),1)) # Variableオブジェクトに変換
        y = Variable(y_data.astype(np.float32).reshape(len(y_data),1)) # Variableオブジェクトに変換
        return F.mean_squared_error(self.predict(x), y)

    def  predict(self, x):
        h1 = F.relu(self.l1(x))
        h2 = F.relu(self.l2(h1))
        h3 = self.l3(h2)
        return h3

    def get_predata(self, x):
        return self.predict(Variable(x.astype(np.float32).reshape(len(x),1))).data

# main
if __name__ == "__main__":

    # 学習データ
    N = 1000
    x_train, y_train = get_dataset(N)

    # テストデータ
    N_test = 900
    x_test, y_test = get_dataset(N_test)

    # 学習パラメータ
    batchsize = 10
    n_epoch = 500
    n_units = 100

    # モデル作成
    model = MyChain(n_units)
    optimizer = optimizers.Adam()
    optimizer.setup(model)

    # 学習ループ
    train_losses =[]
    test_losses =[]
    print "start..."
    start_time = time.time()
    for epoch in range(1, n_epoch + 1):

        # training
        perm = np.random.permutation(N)
        sum_loss = 0
        for i in range(0, N, batchsize):
            x_batch = x_train[perm[i:i + batchsize]]
            y_batch = y_train[perm[i:i + batchsize]]

            model.zerograds()
            loss = model(x_batch,y_batch)
            sum_loss += loss.data * batchsize
            loss.backward()
            optimizer.update()

        average_loss = sum_loss / N
        train_losses.append(average_loss)

        # test
        loss = model(x_test,y_test)
        test_losses.append(loss.data)

        # 学習過程を出力
        if epoch % 10 == 0:
            print "epoch: {}/{} train loss: {} test loss: {}".format(epoch, n_epoch, average_loss, loss.data)

        # 学習結果のグラフ作成
        if epoch in [10, 500]:
            theta = np.linspace(0, 2 * np.pi, N_test)
            sin = np.sin(theta)
            test = model.get_predata(theta)
            plt.plot(theta, sin, label = "sin")
            plt.plot(theta, test, label = "test")
            plt.legend()
            plt.grid(True)
            plt.xlim(0, 2 * np.pi)
            plt.ylim(-1.2, 1.2)
            plt.title("sin")
            plt.xlabel("theta")
            plt.ylabel("amp")
            plt.savefig("fig/fig_sin_epoch{}.png".format(epoch)) # figフォルダが存在していることを前提
            plt.clf()

    print "end"

    interval = int(time.time() - start_time)
    print "実行時間: {}sec".format(interval)


    # 誤差のグラフ作成
    plt.plot(train_losses, label = "train_loss")
    plt.plot(test_losses, label = "test_loss")
    plt.yscale('log')
    plt.legend()
    plt.grid(True)
    plt.title("loss")
    plt.xlabel("epoch")
    plt.ylabel("loss")
    plt.savefig("fig/fig_loss.png") # figフォルダが存在していることを前提
    plt.clf()
実行結果
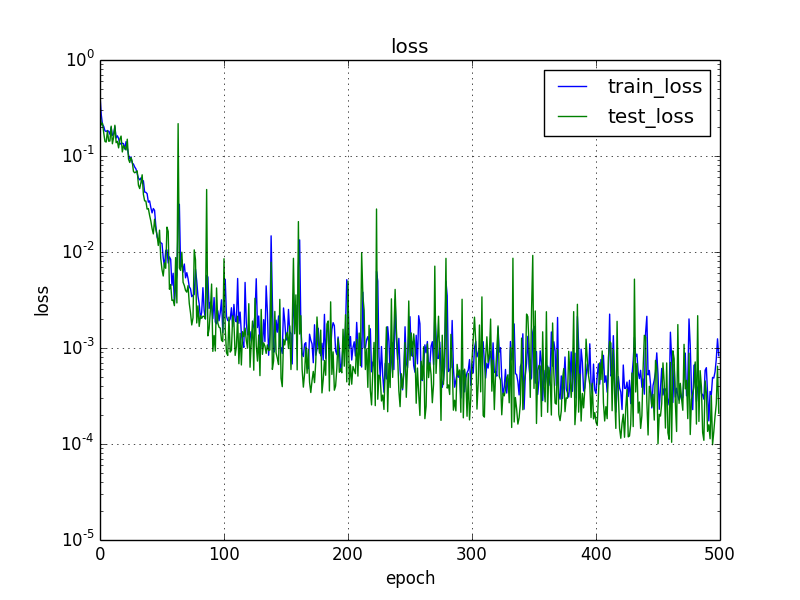
誤差
エポック(学習回数)が増えるほど誤差が小さくなる傾向。学習時とテスト時の誤差に大幅な差はありませんでした。テスト時の誤差が学習時より若干よいのは誤差の求め方が異なるためだと思います。
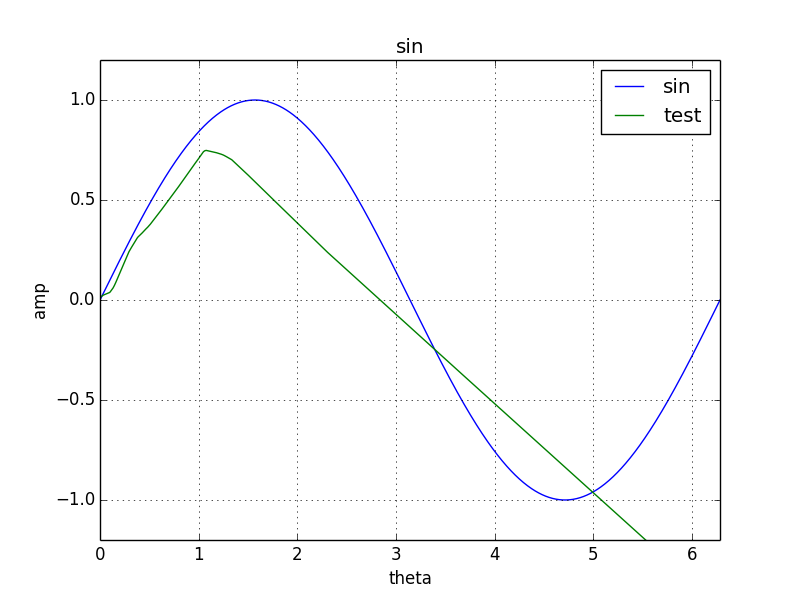
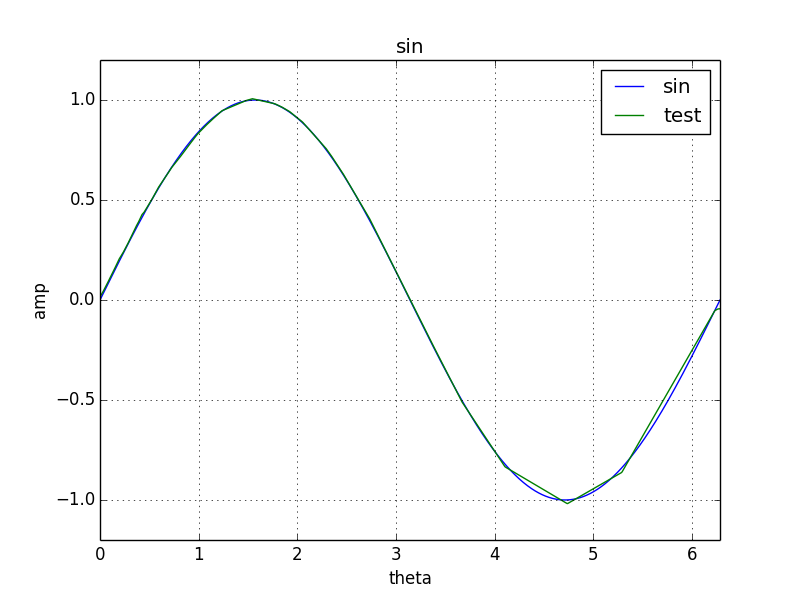
学習結果
エポックが10の時はとてもsin関数とは言い難いですが、500まで学習が進むとsin関数にかなり近づきました。
epoch: 10
epoch: 500
まとめ
とりあえずchainerでsin関数を学習させることができました。
しかし、なぜか角度が大きいほど誤差が大きい傾向になりました。学習させる角度の順番をランダムにすれば角度毎の誤差のバラツキは抑えられると思っていたのですが違うみたいです。よくわかりません。