ここではMatplotlibの基本的なプロットの部品をまとめていきます。
基本的な項目としては、日本語表示、図枠、図の配置、軸、目盛り、マーカーとライン、凡例あたりかなと思います。(Matplotlibにはたくさんの機能がありますが、まずはこのあたりが自由自在に作れるのが基本と思います。)
解説については、冒頭に挙げた参考ページに詳しく書いてあります。また、各項目にもリンクを貼ってあります。項目ごとのリンク集としても使えるかなと思います。
まだ途中ですが、随時更新していきます。
動作確認:Python 3.7.9、Matplotlib 3.3.1
よく参考にするページ
- グラフの基本構造 -Anatomy of a figure-(本家サイトより)
- matplotlib/cheatsheets
- Python♪提出資料で使えるmatplotlibグラフ書式例1
- Python♪提出資料で使えるmatplotlibグラフ書式例2
- Python matplotlib 説明図を書いてみる(改訂版)
- matplotlibのめっちゃまとめ
日本語表示
- matplotlibで日本語
- [Matplotlib が PC で追加のフォントをインストールしなくても日本語を表示できるようになった] (https://blank-oldstranger.com/2018/11/08/matplotlib-japanese/)
- 参考:フォントについて
import matplotlib.pyplot as plt
import numpy as np
%matplotlib inline

# 日本語の使用
from matplotlib import rcParams
rcParams['font.family'] = 'sans-serif'
rcParams['font.sans-serif'] = ['Meirio', 'Hiragino Maru Gothic Pro', 'Yu Gothic',
                              'Takao', 'IPAexGothic', 'IPAPGothic',
                              'VL PGothic', 'Noto Sans CJK JP']
色の設定
-
『Python Data Science Handbook』(英語の無料オンライン版あり)
目盛(Major Ticks、 Minor Ticks)のカスタマイズ
-『Python Data Science Handbook』(英語の無料オンライン版あり) 「4.12 目盛のカスタマイズ」
目盛(Tick Locator)の設定
-Tick locators(matplotlib.orgより)

# https://matplotlib.org/stable/gallery/ticks_and_spines/tick-locators.htmlを編集

import numpy as np
import matplotlib.pyplot as plt
import matplotlib.ticker as ticker

# 日本語fontの設定
from matplotlib import rcParams
rcParams['font.family'] = 'sans-serif'
rcParams['font.sans-serif'] = ['Meirio', 'Hiragino Maru Gothic Pro', 'Yu Gothic',
                              'Takao', 'IPAexGothic', 'IPAPGothic',
                              'VL PGothic', 'Noto Sans CJK JP']


def setup(ax, title):
   """Set up common parameters for the Axes in the example."""
   # only show the bottom spine
   ax.yaxis.set_major_locator(ticker.NullLocator())
   ax.spines['right'].set_color('none') #ver.3.4.1では、ax.spines.right.set_color('none')
   ax.spines['left'].set_color('none') #ver.3.4.1では、ax.spines.left.set_color('none')
   ax.spines['top'].set_color('none') #ver.3.4.1では、ax.spines.top.set_color('none')

   ax.xaxis.set_ticks_position('bottom')
   ax.tick_params(which='major', width=1.00, length=5)
   ax.tick_params(which='minor', width=0.75, length=2.5)
   ax.set_xlim(0, 5)
   ax.set_ylim(0, 1)
   ax.text(0.0, 0.2, title, transform=ax.transAxes,
           fontsize=14, color='tab:blue')


fig, axs = plt.subplots(8, 1, figsize=(8, 6))

# Null Locator
setup(axs[0], title="NullLocator() 目盛の非表示")
axs[0].xaxis.set_major_locator(ticker.NullLocator())
axs[0].xaxis.set_minor_locator(ticker.NullLocator())

# Multiple Locator
setup(axs[1], title="MultipleLocator(0.5)  倍数目盛")
axs[1].xaxis.set_major_locator(ticker.MultipleLocator(0.5))
axs[1].xaxis.set_minor_locator(ticker.MultipleLocator(0.1))

# Fixed Locator
setup(axs[2], title="FixedLocator([0, 1, 5]) リストで固定された目盛")
axs[2].xaxis.set_major_locator(ticker.FixedLocator([0, 1, 5]))
axs[2].xaxis.set_minor_locator(ticker.FixedLocator(np.linspace(0.2, 0.8, 4)))

# Linear Locator
setup(axs[3], title="LinearLocator(numticks=3)  minからmaxまで等間隔の目盛")
axs[3].xaxis.set_major_locator(ticker.LinearLocator(3))
axs[3].xaxis.set_minor_locator(ticker.LinearLocator(31))

# Index Locator
setup(axs[4], title="IndexLocator(base=0.5, offset=0.25)  indexをもつ目盛")
axs[4].plot(range(0, 5), [0]*5, color='white')
axs[4].xaxis.set_major_locator(ticker.IndexLocator(base=0.5, offset=0.25))

# MaxN Locator
setup(axs[5], title="MaxNLocator(n=4)  最大値に適切に割り振られた目盛")
axs[5].xaxis.set_major_locator(ticker.MaxNLocator(4))
axs[5].xaxis.set_minor_locator(ticker.MaxNLocator(40))

# Auto Locator
setup(axs[6], title="AutoLocator() MaxNLocatorと単純なデフォルト値")
axs[6].xaxis.set_major_locator(ticker.AutoLocator())
axs[6].xaxis.set_minor_locator(ticker.AutoMinorLocator())

# Log Locator
setup(axs[7], title="LogLocator(base=10, numticks=15) minからmaxまでの対数目盛")
axs[7].set_xlim(10**3, 10**10)
axs[7].set_xscale('log')
axs[7].xaxis.set_major_locator(ticker.LogLocator(base=10, numticks=15))

plt.savefig("tick-locators.png")

plt.tight_layout()
plt.show()
目盛フォーマット(Tick Formatters)の設定

# https://matplotlib.org/stable/gallery/ticks_and_spines/tick-formatters.html?highlight=tick%20formatを編集
import matplotlib.pyplot as plt
from matplotlib import ticker
# 日本語fontの設定
from matplotlib import rcParams
rcParams['font.family'] = 'sans-serif'
rcParams['font.sans-serif'] = ['Meirio', 'Hiragino Maru Gothic Pro', 'Yu Gothic',
'Takao', 'IPAexGothic', 'IPAPGothic',
'VL PGothic', 'Noto Sans CJK JP']
def setup(ax, title):
"""Set up common parameters for the Axes in the example."""
# only show the bottom spine
ax.yaxis.set_major_locator(ticker.NullLocator())
ax.spines['right'].set_color('none') #ver.3.4.1では、ax.spines.right.set_color('none')
ax.spines['left'].set_color('none') #ver.3.4.1では、ax.spines.left.set_color('none')
ax.spines['top'].set_color('none') #ver.3.4.1では、ax.spines.top.set_color('none')
# define tick positions
ax.xaxis.set_major_locator(ticker.MultipleLocator(1.00))
ax.xaxis.set_minor_locator(ticker.MultipleLocator(0.25))
ax.xaxis.set_ticks_position('bottom')
ax.tick_params(which='major', width=1.00, length=5)
ax.tick_params(which='minor', width=0.75, length=2.5, labelsize=10)
ax.set_xlim(0, 5)
ax.set_ylim(0, 1)
ax.text(0.0, 0.2, title, transform=ax.transAxes,
fontsize=14, color='tab:blue')
# Tick formatters can be set in one of two ways, either by passing a ``str``
# or function to `~.Axis.set_major_formatter` or `~.Axis.set_minor_formatter`,
# or by creating an instance of one of the various `~.ticker.Formatter` classes
# and providing that to `~.Axis.set_major_formatter` or
# `~.Axis.set_minor_formatter`.
# The first two examples directly pass a ``str`` or function.
fig0, axs0 = plt.subplots(2, 1, figsize=(8, 2))
fig0.suptitle('Simple Formatting')
# A ``str``, using format string function syntax, can be used directly as a
# formatter. The variable ``x`` is the tick value and the variable ``pos`` is
# tick position. This creates a StrMethodFormatter automatically.
setup(axs0[0], title="'{x} km'")
axs0[0].xaxis.set_major_formatter('{x} km')
# A function can also be used directly as a formatter. The function must take
# two arguments: ``x`` for the tick value and ``pos`` for the tick position,
# and must return a ``str`` This creates a FuncFormatter automatically.
setup(axs0[1], title="lambda x, pos: str(x-5)")
axs0[1].xaxis.set_major_formatter(lambda x, pos: str(x-5))
fig0.tight_layout()
plt.savefig("tick-formatter1.png", bbox_inches='tight', pad_inches=0.1)
# The remaining examples use Formatter objects.
fig1, axs1 = plt.subplots(7, 1, figsize=(8, 6))
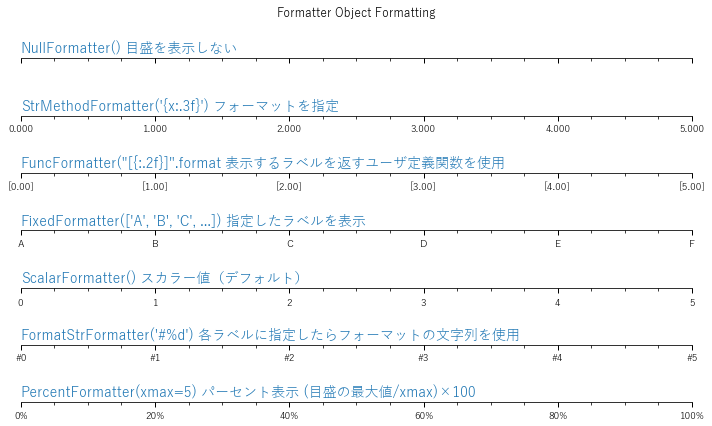
fig1.suptitle('Formatter Object Formatting')
# Null formatter
setup(axs1[0], title="NullFormatter() 目盛を表示しない")
axs1[0].xaxis.set_major_formatter(ticker.NullFormatter())
# StrMethod formatter
setup(axs1[1], title="StrMethodFormatter('{x:.3f}') フォーマットを指定")
axs1[1].xaxis.set_major_formatter(ticker.StrMethodFormatter("{x:.3f}"))
# FuncFormatter can be used as a decorator
@ticker.FuncFormatter
def major_formatter(x, pos):
return f'[{x:.2f}]'
setup(axs1[2], title='FuncFormatter("[{:.2f}]".format 表示するラベルを返すユーザ定義関数を使用')
axs1[2].xaxis.set_major_formatter(major_formatter)
# Fixed formatter
setup(axs1[3], title="FixedFormatter(['A', 'B', 'C', ...]) 指定したラベルを表示")
# FixedFormatter should only be used together with FixedLocator.
# Otherwise, one cannot be sure where the labels will end up.
positions = [0, 1, 2, 3, 4, 5]
labels = ['A', 'B', 'C', 'D', 'E', 'F']
axs1[3].xaxis.set_major_locator(ticker.FixedLocator(positions))
axs1[3].xaxis.set_major_formatter(ticker.FixedFormatter(labels))
# Scalar formatter
setup(axs1[4], title="ScalarFormatter() スカラー値(デフォルト)")
axs1[4].xaxis.set_major_formatter(ticker.ScalarFormatter(useMathText=True))
# FormatStr formatter
setup(axs1[5], title="FormatStrFormatter('#%d') 各ラベルに指定したらフォーマットの文字列を使用")
axs1[5].xaxis.set_major_formatter(ticker.FormatStrFormatter("#%d"))
# Percent formatter
setup(axs1[6], title="PercentFormatter(xmax=5) パーセント表示 (目盛の最大値/xmax)×100")
axs1[6].xaxis.set_major_formatter(ticker.PercentFormatter(xmax=5))
fig1.tight_layout()
plt.savefig("tick-formatter2.png", bbox_inches='tight', pad_inches=0.1)
# plt.show()
LineとMarkerのパターン
- matplotlib.axes.Axes.plot
- 8.スタイルの設定に関して(matplotlibのめっちゃまとめ より)
- Markers(matplotlib/cheatsheetsより)
- Lines(matplotlib/cheatsheetsより)

fig = plt.figure(figsize=(20,3))
ax = fig.add_subplot(111, xlim=(-1, 40), ylim=(0.05, 0.2), frameon=False, xticks=[], yticks=[])

# Lineをプロット
ls_list = ['-','--', ':', '-.']

for i, ls in enumerate(ls_list):
   text = "'%s'" % ls
   ax.text(10*i+4, 0.17, text, size=30, va='center')
   ax.plot([10*i+2, 10*i+7], [0.15, 0.15], ls, color='black', linewidth=2)
ax.text(-1, 0.16, 'Lines', size=20, ha='left');

# Markerをプロット
m_list = ['.', ',', 'o', 'v', '^', '<', '>', '1', '2', '3', '4', '8', 's',
         'p', '*', 'h', 'H', '+', 'P', 'x', 'X', 'D', 'd', '|', '_',
         0, 1, 2, 3, 4, 5, 6, 7, 8, 9, 10, 11, '']

for i, m in enumerate(m_list):
   ax.plot(i+3, 0.1, c='gainsboro',
           marker=m, ms=15, mfc='lightsteelblue', mew=1.5, mec='royalblue')
   ax.text(i+3, 0.12, m, size=20, ha='center')
ax.text(-1, 0.12, 'Markers', size=20, ha='left')

fig.savefig('MarkerandLines.png')
シンプルなプロット(パターン1)
import matplotlib as mpl
import matplotlib.pyplot as plt
from matplotlib.ticker import AutoMinorLocator, MultipleLocator
import numpy as np

# 日本語fontの設定
from matplotlib import rcParams
rcParams['font.family'] = 'sans-serif'
rcParams['font.sans-serif'] = ['Meirio', 'Hiragino Maru Gothic Pro', 'Yu Gothic',
                               'Takao', 'IPAexGothic', 'IPAPGothic',
                               'VL PGothic', 'Noto Sans CJK JP']
%matplotlib inline


# データの作成
x = np.linspace(0, 20, 1000)
y1 = 0.8 * np.sin(x)
y2 = 0.8 * np.cos(x)


# 作図パラメータの設定
figsize = (10, 5)  #図のプロットサイズ
hspace, wspace = 0.4, 0.4  #プロットの間隔(サブプロットの幅と高さに対する比率(0.2→20%))

xmin, xmax, dx = 0, 20, 1.0 # lower limit, upper limit and increment of of axis
ymin, ymax, dy = -1, 1, 0.2

nAutoMinorLoc_x, nAutoMinorLoc_y = 4, 4  # Number of AutoMinorLocator

title = 'Fig. Sample1'
xlabel, ylabel = 'x軸 [単位]', 'y axis [Unit]'


# 作図
fig = plt.figure(figsize=figsize)
fig.subplots_adjust(hspace=hspace, wspace=wspace)

ax = fig.add_subplot(1, 1, 1)
ax.plot(x, y1, linewidth=2, color='royalblue', label="sin x")
ax.plot(x, y2, '--', linewidth=1, color='orangered', label="cos x")
ax.plot(x[100], y1[100], 'o', markersize=10, markeredgecolor='navy',
        markeredgewidth=2.0, markerfacecolor='0.8', label='')

# 図のタイトル
ax.set_title(title, fontsize=20)

# 軸の設定
ax.set(xlim=(xmin, xmax), ylim=(ymin, ymax))

ax.set_xlabel(xlabel, fontsize=12)
ax.set_ylabel(ylabel, fontsize=12)

ax.xaxis.set_major_locator(MultipleLocator(dx)) #指定した数の倍数に主目盛りが設定される
ax.xaxis.set_minor_locator(AutoMinorLocator(nAutoMinorLoc_x))
ax.yaxis.set_major_locator(MultipleLocator(dy))
ax.yaxis.set_minor_locator(AutoMinorLocator(nAutoMinorLoc_y))

ax.tick_params(which='both', direction='in', width=1.0, labelsize=12, labelcolor='black')
ax.tick_params(which='major', length=6)
ax.tick_params(which='minor', length=3);

ax.grid(which='major', axis='both', linestyle="-", linewidth=0.5, color='0.5') #, zorder=-10

# y=0のラインの追加
ax.axhline(0, 0, 1, linestyle="-", linewidth=1, color='black')


# 凡例の設定
ax.legend(bbox_to_anchor=(1.01, 1), loc='upper left', borderaxespad=0, fontsize=12)

# 図の出力
fig.savefig("case1.jpg", bbox_inches='tight', pad_inches=0.1, dpi=200);

以下、更新中