はじめに
wolfram alphaに数式をいれるとグラフを生成してくれますが、もっと明示的に指示したいときの方法です。
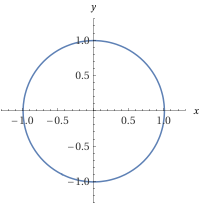
x^2+y^2=1 |
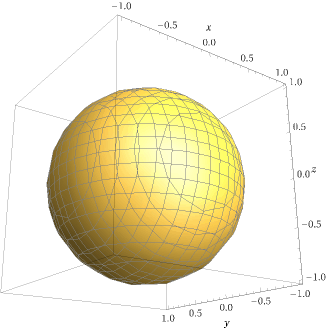
x^2+y^2+z^2=1 |
|---|---|
 |
 |
媒介変数によるグラフ
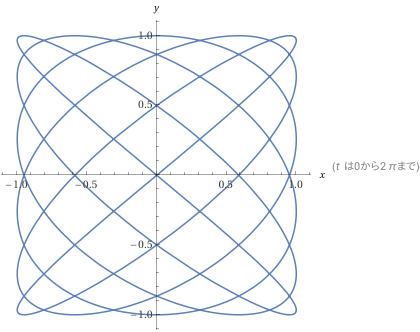
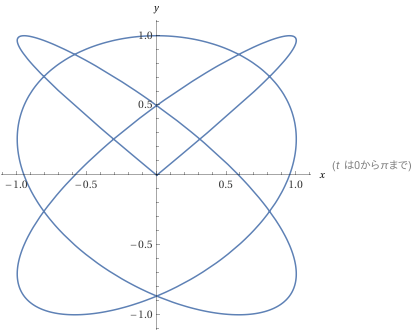
plot x = sin(6t), y = sin(5t)
または
plot x = sin(6t), y = sin(5t) for t from 0 to 2pi
または
parametric plot sin(6t), sin(5t) for t from 0 to 2pi
| 1 | 2 |
|---|---|
 |
 |
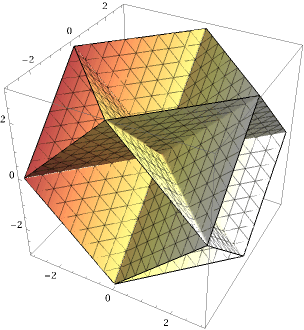
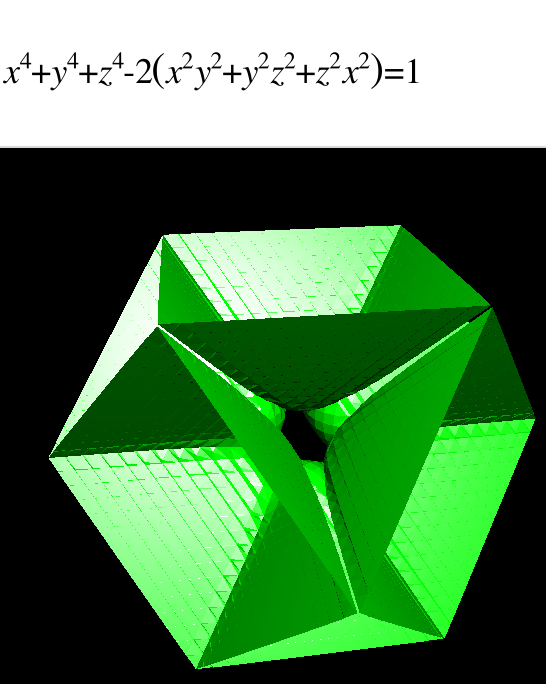
3次元グラフ
ContourPlot3D[x^4+y^4+z^4-2(x^2y^2+y^2z^2+z^2x^2)==0,{x,-3,3},{y,-3,3},{z,-3,3}]
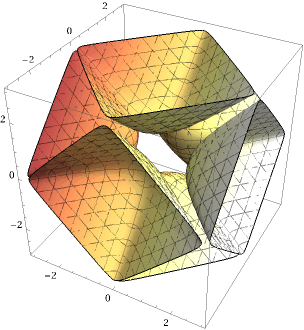
ContourPlot3D[x^4+y^4+z^4-2(x^2y^2+y^2z^2+z^2x^2)==1,{x,-3,3},{y,-3,3},{z,-3,3}]
※URL指定でwolfram alphaに直接飛ばせるが、プラス記号は%2Bに置き換える必要があった。
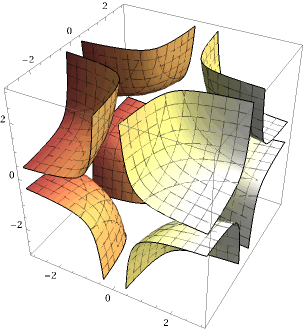
ContourPlot3D[x^4y^4z^4-2(x^2y^2+y^2z^2+z^2x^2)==1,{x,-3,3},{y,-3,3},{z,-3,3}]
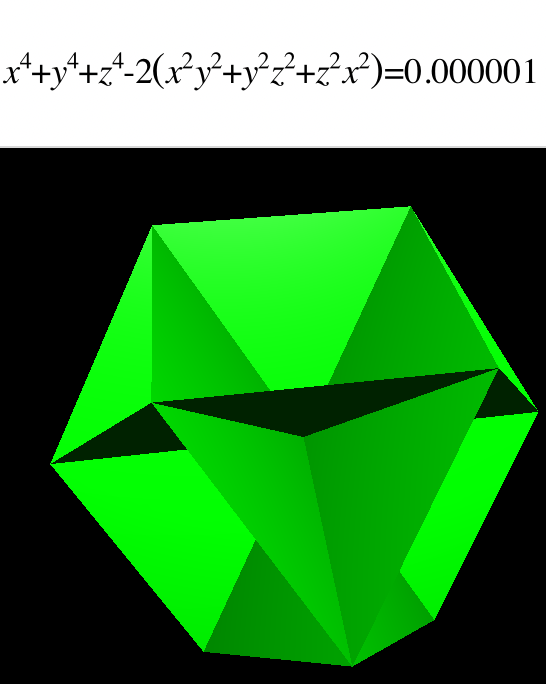
おまけ
Macに付属のGrapherでの描画です
 |
 |