fx-CG50 用の Matplotlib は公開されていた
Graph Math+ に搭載されている Matplotlib は機能の制約があることを CASIO Graph Math+ で 情報I の Python 課題をやってみる で確認した。
fx-CG50 には Matplotlib が搭載されていなかったため、一時期公式が Matplotlib モジュールのファイルを配布していた。現在公式の配布は終了したようだが、 TI-Planet の掲示板からダウンロードすることが可能である。
Graph Math+ に搭載されている Matplotlib が fx-CG50 用と同一のものかはわからないが、 MicroPython のバージョンが同じてあることから、 Matplotlib の内容もほとんど変わらないものと推測される。
そこで、 fx-CG50 の Matplotlib の中身を見て、実装されている機能を確認することにした。
定義されている関数とオプション
- axis(
*L) 軸
'off','on' 軸目盛り表示の有無
'auto'
[xmin, xmax, ymin, ymax] x, y それぞれ最小値・最大値指定 - text(
x,y,txt) テキスト - plot(
*L,**kwargs) 折れ線
'color' 色指定(下記色 + white, grey, orange, purple, brown, pink)
色無指定時の系列毎色割り当て blue→red→green→magenta→black→cyan→yellowの順
'o','.','+','*','-' は使用形跡見られず (ダミーオプション?) - show() グラフの表示
- bar(val,eff,width=0.8) 棒グラフ
- scatter(xlist,ylist) 散布図
- hist(x,bins=10,**kwargs) ヒストグラム
'hist_type','std' ビンの算出方法('fr','std') frはフランス式? - boxplot(L,**kwargs) 箱ひげ図
'boxplot_type','std' 四分位の算出方法('fr','std') frはフランス式?
'whis',1.5 ヒゲの長さ - arrow(x,y,dx,dy,**kwargs) 矢印
'ec' 'edgecolor','k' 矢印の線色
'fc' 'facecolor','b' 矢印の頭の色
'head_width',0.003 矢印の頭の幅
'head_length',1.5*L 矢印の頭の長さ - grid(*a,**kwargs) グラフ
'color' 色、無指定時はgrey
矢印の設定項目が細かくある一方、ほとんどのグラフの設定項目は少な目。
軸の設定も x, y の範囲程度で、目盛り間隔の設定関数すら用意されていない。
機能を拡張してみる
Matplotlib が py ファイル1つで実現されていることから、この py ファイルを修正することで機能を拡張することも可能である。
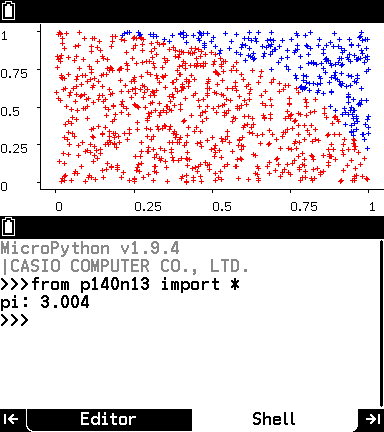
CASIO Graph Math+ で 情報I の Python 課題をやってみる で scatter 関数の機能不足から実行できなかった p140 図表13 のスクリプトについて、実行できるように改良してみる。
plot 関数や grid 関数の色指定を参考に、 scatter 関数の色指定を追加。
※ fx-CG50 、 Graph Math+ とも、本体のエディタは300行を超えるソースファイルを編集できない。 Matplotlib の py ファイルは PC などで編集する必要がある。
def scatter(xlist,ylist,**kwargs):
    global color_count
    color=kwargs.get('color')
    if isinstance(xlist,(tuple)):
        xlist=list(xlist)
    if isinstance(ylist,(tuple)):
        ylist=list(ylist)
    if isinstance(xlist,(int,float)):
        xlist=[xlist]
    if isinstance(ylist,(int,float)):
        ylist=[ylist]
    if isinstance(xlist,(list)) and isinstance(ylist,(list)):
        if len(xlist)==len(ylist):
            if color not in available_colors:
                raise ValueError('function scatter() : unknown color code')
            elif color!=None:
                c=color
                for i in range(len(xlist)):
                    plot(xlist[i],ylist[i],c)
            else:
                for i in range(len(xlist)):
                    plot(xlist[i],ylist[i],color_auto[color_count%7])
                color_count+=1
        else:
            raise ValueError('function scatter() : x and y lists must have same dimension')
    else:
        raise ValueError('function scatter() : error using arguments')
import random
from matp import *
totalcount = 1000
incount = 0
for i in range(totalcount):
  x = random.random()
  y = random.random()
  if x**2 + y**2 < 1.0:
    incount += 1
    scatter(x,y,color="red")
  else:
    scatter(x,y,color="blue")
print("pi:", incount * 4.0 / totalcount)
show()
