はじめに
極座標のグラフの基本的な使い方をまとめました.
よく見る円形のグラフを作る時に最適です.
また内容の不備や, 追加すべき項目等ありましたら, コメントにてお知らせください.
参考 : matplotlib.org -Pie and polar charts-
極座標を用意する
以下のどちらの方法でも極座標グラフを作成できます.
方法1: 引数projectionを設定する
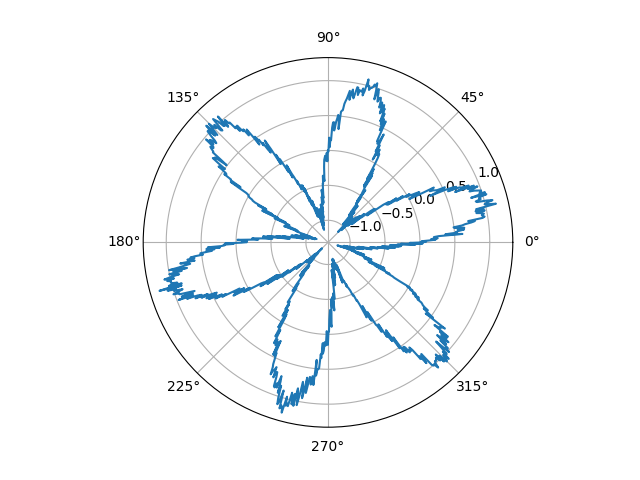
subplot(add_subplotでも可)の引数projectionに"polar"を渡します.
import numpy as np
import matplotlib.pyplot as plt

def main():
    ax = plt.subplot(111, projection="polar")

    size = 1000

    x = np.linspace(0, 2 * np.pi, size)
    y = np.sin(6*x) + np.random.normal(0, 0.08, (size))

    ax.plot(x, y)

    plt.show()

if __name__ == '__main__':
    main()
方法2 : 引数polarを設定する
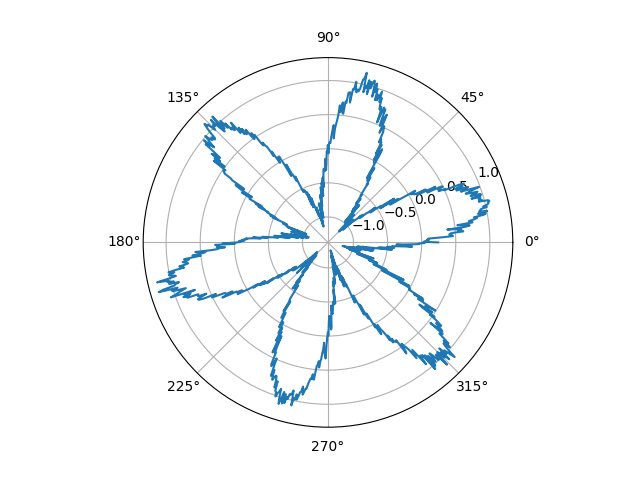
subplot(add_subplotでも可)の引数polarにTrueを渡します.
import numpy as np
import matplotlib.pyplot as plt

def main():
    ax = plt.subplot(111, polar=True)

    size = 1000

    x = np.linspace(0, 2 * np.pi, size)
    y = np.sin(6*x) + np.random.normal(0, 0.08, (size))

    ax.plot(x, y)

    plt.show()

if __name__ == '__main__':
    main()
極座標プロットでの設定
座標指定
極座標なので, もちろん単純な($x$, $y$)ではなく, 極座標形式($r$, $\theta$)で入力する必要があります.
グラフの軸/描画範囲等の設定
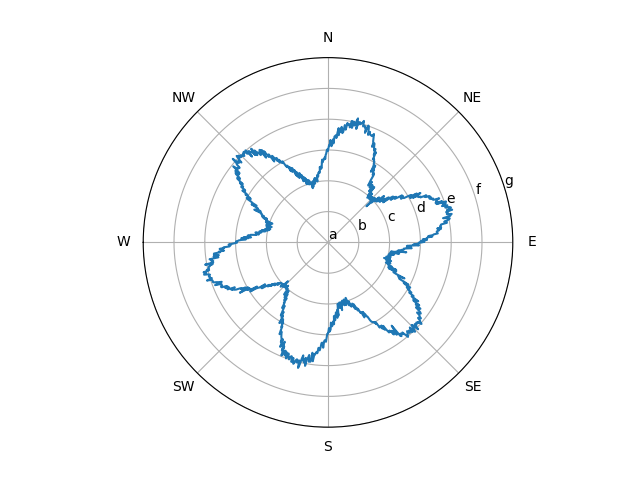
なるべくxyと同じような設定方法で行いたい時
import numpy as np
import matplotlib.pyplot as plt

def main():
    ax = plt.subplot(111, polar=True)

    size = 1000

    x = np.linspace(0, 2 * np.pi, size)
    y = np.sin(6*x) + np.random.normal(0, 0.08, (size))

    ax.plot(x, y)

    abc = [chr(i) for i in range(ord("a"), ord("z"), 1)]

    # r方向の設定, 設定は y で可能
    ax.set_ylim([-3.0, 3.0])
    ax.set_yticks(np.arange(-3, 3.01, 1))
    ax.set_yticklabels(abc)

    # theta方向の設定, 設定は x で可能
    ax.set_xlim([-np.pi, np.pi])
    ax.set_xticks(np.linspace(-np.pi, np.pi, 9)[1:])
    ax.set_xticklabels(["SW", "S", "SE", "E", "NE", "N", "NW", "W"])

    # r軸のラベルを移動する (度数法)
    ax.set_rlabel_position(17)

    plt.show()

if __name__ == '__main__':
    main()
r, thetaで設定していく場合
Axes.set_rlim, Axes.set_rgrids, Axes.set_thetalim, Axes.set_thetagridsで設定していきます.
| メソッド | 内容 |
|---|---|
Axes.set_rlim |
r方向の表示範囲 |
Axes.set_rgrids |
r方向の主軸, 軸ラベルの設定, 軸ラベルの位置 |
Axes.set_thetalim |
$\theta$方向の表示範囲 |
Axes.set_thetagrids |
$\theta$方向の主軸, 軸ラベルの設定 |
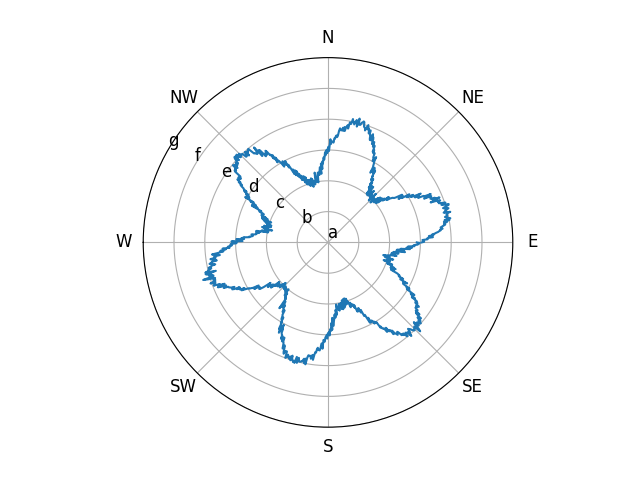
Axes.set_rgridsでは軸ラベルの位置の設定も簡単に行なえます.
import numpy as np
import matplotlib.pyplot as plt

def main():
    ax = plt.subplot(111, polar=True)

    size = 1000

    x = np.linspace(0, 2 * np.pi, size)
    y = np.sin(6*x) + np.random.normal(0, 0.08, (size))

    ax.plot(x, y)

    abc = [chr(i) for i in range(ord("a"), ord("z"), 1)]

    # r方向の設定, 軸ラベルの位置も変更できる
    ax.set_rlim([-3.0, 3.0])
    ax.set_rgrids(np.arange(-3, 3.01, 1),
                  labels=abc,
                  fontsize=12,
                  angle=150) # angle で 表示方向を選択(度数法)

    # theta方向の設定
    ax.set_thetalim([-np.pi, np.pi])
    # ラジアンではなく, 度数法で指定するっぽい
    ax.set_thetagrids(np.rad2deg(np.linspace(-np.pi, np.pi, 9)[1:]),
                      labels=["SW", "S", "SE", "E", "NE", "N", "NW", "W"],
                      fontsize=12)

    plt.show()

if __name__ == '__main__':
    main()
theta軸の始点を変更する (全体を回転させる)
ax.set_theta_zero_location()で軸の開始位置を変更できる.
引数は"S"や"E", "SW"などの方角の文字列.
例えば"S"を渡せば, 南の位置に軸の始点が置かれることになる.
import numpy as np
import matplotlib.pyplot as plt

def main():
    ax = plt.subplot(111, polar=True)

    size = 1000

    x = np.linspace(0, 2 * np.pi, size)
    y = np.sin(6*x) + np.random.normal(0, 0.08, (size))

    ax.plot(x, y)

    abc = [chr(i) for i in range(ord("a"), ord("z"), 1)]

    # r方向の設定
    ax.set_rlim([-3.0, 3.0])
    ax.set_rgrids(np.arange(-3, 3.01, 1),
                  labels=abc,
                  fontsize=12)

    # theta方向の設定
    ax.set_thetalim([-np.pi, np.pi])
    ax.set_thetagrids(np.rad2deg(np.linspace(-np.pi, np.pi, 9)[1:]),
                      labels=["SW", "S", "SE", "E", "NE", "N", "NW", "W"],
                      fontsize=12)

    ax.set_rlabel_position(-10)

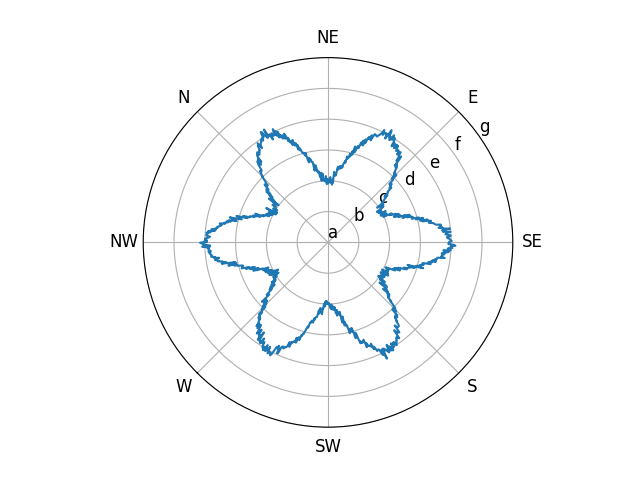
    ax.set_theta_zero_location("NE") # <-- 追加 : 始点を北東の位置へ

    plt.show()

if __name__ == '__main__':
    main()
上記のプログラムでは"NE"を設定したので, 北東の位置に始点であるEのラベルが来ていることがわかります.
theta軸の回転方向を変更する
ax.set_theta_direction()で軸の回転方向を変えられます.
1 : 反時計回り(デフォルト方向)
-1 : 時計回り(逆回り)
import numpy as np
import matplotlib.pyplot as plt

def main():
    ax = plt.subplot(111, polar=True)

    size = 1000

    x = np.linspace(0, 2 * np.pi, size)
    y = np.sin(6*x) + np.random.normal(0, 0.08, (size))

    ax.plot(x, y)

    abc = [chr(i) for i in range(ord("a"), ord("z"), 1)]

    # r方向の設定
    ax.set_rlim([-3.0, 3.0])
    ax.set_rgrids(np.arange(-3, 3.01, 1),
                  labels=abc,
                  fontsize=12)

    # theta方向の設定
    ax.set_thetalim([-np.pi, np.pi])
    ax.set_thetagrids(np.rad2deg(np.linspace(-np.pi, np.pi, 9)[1:]),
                      labels=["SW", "S", "SE", "E", "NE", "N", "NW", "W"],
                      fontsize=12)

    ax.set_rlabel_position(-10)

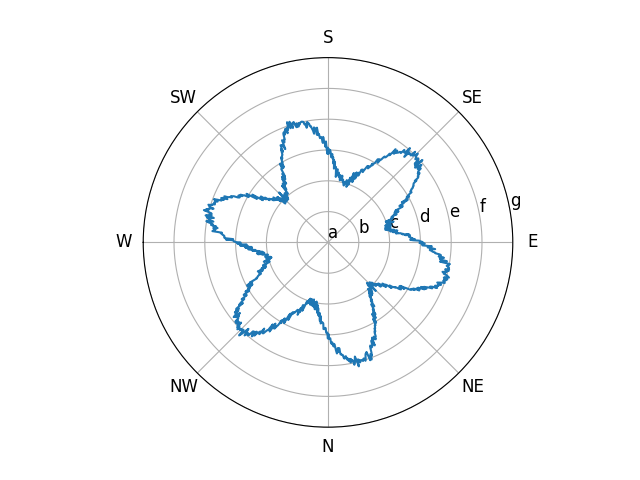
    ax.set_theta_direction(-1) # <-- 追加 : 時計回り(逆回り)

    plt.show()

if __name__ == '__main__':
    main()
枠(外縁)を消す
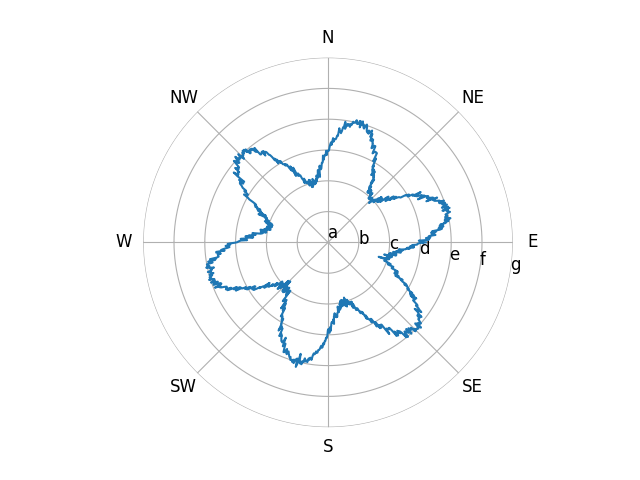
ax.spines['polar'].set_visible(False)で一番外側の円形の枠を見えなくすることができます.
import numpy as np
import matplotlib.pyplot as plt

def main():
    ax = plt.subplot(111, polar=True)

    size = 1000

    x = np.linspace(0, 2 * np.pi, size)
    y = np.sin(6*x) + np.random.normal(0, 0.08, (size))

    ax.plot(x, y)

    abc = [chr(i) for i in range(ord("a"), ord("z"), 1)]

    # r方向の設定
    ax.set_rlim([-3.0, 3.0])
    ax.set_rgrids(np.arange(-3, 3.01, 1),
                  labels=abc,
                  fontsize=12)

    # theta方向の設定
    ax.set_thetalim([-np.pi, np.pi])
    ax.set_thetagrids(np.rad2deg(np.linspace(-np.pi, np.pi, 9)[1:]),
                      labels=["SW", "S", "SE", "E", "NE", "N", "NW", "W"],
                      fontsize=12)

    ax.set_rlabel_position(-10)

    ax.spines['polar'].set_visible(False) # <-- 追加 : 軸の削除

    plt.show()

if __name__ == '__main__':
    main()
すっきりしました.
極座標での各プロット
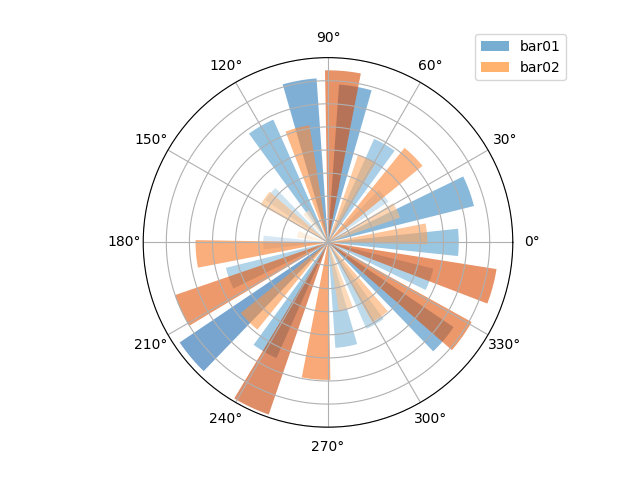
棒グラフ
import numpy as np
import matplotlib.pyplot as plt

def main():
    ax = plt.subplot(111, polar=True)

    bin_num = 18
    random_range = [0, 8]

    x = np.linspace(0, 2 * np.pi, bin_num, endpoint=False)
    y01 = random_range[1]*np.random.rand(bin_num)
    y02 = random_range[1]*np.random.rand(bin_num)

    bar01 = ax.bar(x, y01, width=0.6*(2*np.pi/bin_num), label="bar01", alpha=0.6)
    bar02 = ax.bar(x+0.5*(2*np.pi/bin_num)/2, y02, width=0.6*(2*np.pi/bin_num), label="bar02", alpha=0.6)

    ax.set_rlim(random_range)
    ax.set_rgrids(range(random_range[0], random_range[1]+1), labels=[])

    ax.set_thetagrids(range(0, 360, 30))

    ax.legend(loc="lower left", bbox_to_anchor=(0.88, 0.92))

    for y, b in zip(y01, bar01):
        b.set_facecolor(plt.cm.Blues(y / 10.))

    for y, b in zip(y02, bar02):
        b.set_facecolor(plt.cm.Oranges(y / 10.))

    plt.show()

if __name__ == '__main__':
    main()
折れ線グラフ
import numpy as np
import matplotlib.pyplot as plt

def func(x):
    coe_sin = np.random.rand() - 0.5
    coe_cos = np.random.rand() - 0.5

    return coe_sin * np.sin(x) + coe_cos * np.cos(x)

def main():
    ax = plt.subplot(111, polar=True)

    point_num = 1000

    x = np.linspace(0, 2 * np.pi, point_num, endpoint=False)
    y01 = func(2*x) + func(4*x) + func(6*x) + func(10*x)
    y02 = func(2*x) + func(4*x) + func(6*x) + func(10*x)

    ax.plot(x, y01, label="plot01")
    ax.plot(x, y02, label="plot02")

    r_bottom = -3
    ax.set_rlim(bottom=r_bottom)
    ax.set_rgrids(np.arange(r_bottom, np.ceil(max(np.max(y01), np.max(y02)))+0.1, 1))

    ax.legend(loc="lower left", bbox_to_anchor=(0.88, 0.92))

    plt.show()

if __name__ == '__main__':
    main()
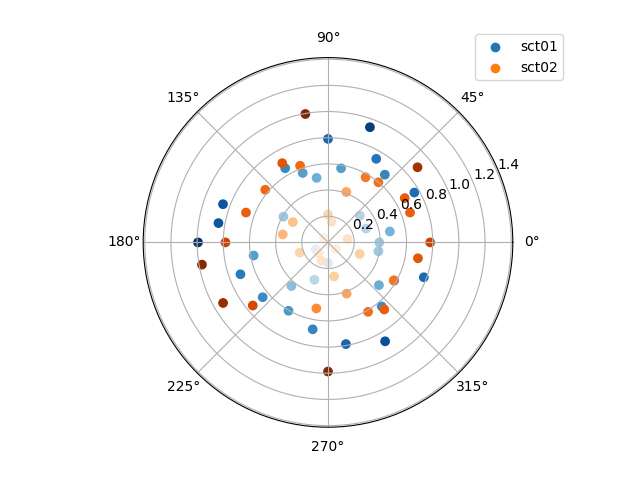
散布図
import numpy as np
import matplotlib.pyplot as plt

def func(x):
    coe_sin = np.random.rand() - 0.5
    coe_cos = np.random.rand() - 0.5

    return coe_sin * np.sin(x) + coe_cos * np.cos(x)

def main():
    ax = plt.subplot(111, polar=True)

    point_num = 36

    x = np.linspace(0, 2 * np.pi, point_num, endpoint=False)
    y01 = np.random.rand(point_num)
    y02 = np.random.rand(point_num)

    sct01 = ax.scatter(x, y01, c=y01, cmap=plt.cm.Blues)
    sct02 = ax.scatter(x, y02, c=y02, cmap=plt.cm.Oranges)

    # legend用に色をセット
    sct01.set_facecolor("C0")
    sct02.set_facecolor("C1")

    ax.legend([sct01, sct02], ["sct01", "sct02"], loc="lower left", bbox_to_anchor=(0.88, 0.92))

    plt.show()

if __name__ == '__main__':
    main()
