Seq2Seq とは
シーケンスのペアを大量に学習させることで、片方のシーケンスからもう一方を生成するモデルです。
実用例としては以下のようなものがあります。
- 翻訳: 英語 -> フランス語 のペアを学習。英語を入力するとフランス語に翻訳してくれる。
- 構文解析: 英語 -> 構文木 のペアを学習。英語を入力すると構文木を返してくれる。
- 会話bot: 問いかけ -> 返答 のペアを学習。「お腹減った」に対して「ご飯行こうぜ」などと返してくれる。
いろいろ夢の広がるモデルです。
LSTM を使った以下のような形をしたネットワークで、入力を内部表現に変換するエンコーダ部分(画像左半分)と内部表現から出力を得るデコーダ(画像右半分)で構成されます。

引用元:TensorFlow
Seq2Seq を簡単に試したい!
Fariz Rahman さんが Keras での Seq2Seq ライブラリを公開しています。
https://github.com/farizrahman4u/seq2seq
このライブラリは単純な Seq2Seq のみならず以下のような拡張された Seq2Seq もとても簡単に使えるスグレモノに見えます。
- Simple Seq2Seq
- Deep Seq2Seq: Stacked LSTM を用いたもの
- Peeky Seq2Seq: エンコーダが出力するコンテキストベクトルを、デコーダーの各出力・隠れ層に流すバージョン・・のように見えますがちゃんと論文は読んでいません
- Seq2seq model with attention: 参考: seq2seq で長い文の学習をうまくやるための Attention Mechanism について
環境
以下の環境で実装を行いました。
- python3.5.2
- tensorflow1.0
基本的な環境については p2 インスタンスへの TensorFlow 導入 が参考になるかもしれません。
更に、 DeepLearning をするための高級フレームワークの Keras をインストールします。
pip3 install keras
Seq2Seq が依存している、 ReccurentShop をインストールします。
https://github.com/datalogai/recurrentshop
git clone https://www.github.com/datalogai/recurrentshop.git
cd recurrentshop
python setup.py install
後は、 Seq2Seq ライブラリのインストールをします。
https://github.com/farizrahman4u/seq2seq
pip3 install git+https://github.com/farizrahman4u/seq2seq.git
追加で必要な matplotlib を入れておきます。
pip3 install matplotlib
実装
ipython で適当に動かしながら作ったやつなので変数名がクソなのは許してください
from seq2seq.models import SimpleSeq2Seq
import numpy as np
import matplotlib.pylab as plt

# シンプルな Seq2Seq モデルを構築
model = SimpleSeq2Seq(input_dim=1, hidden_dim=10, output_length=8, output_dim=1)

# 学習の設定
model.compile(loss='mse', optimizer='rmsprop')

# データ作成
# 入力:1000パターンの位相を持つ一次元のサイン波
# 出力:各入力の逆位相のサイン波
a = np.random.random(1000)
x = np.array([np.sin([[p] for p in np.arange(0, 0.8, 0.1)] + aa) for aa in a])
y = -x

# 学習
model.fit(x, y, nb_epoch=5, batch_size=32)

# 未学習のデータでテスト
x_test = np.array([np.sin([[p] for p in np.arange(0, 0.8, 0.1)] + aa) for aa in np.arange(0, 1.0, 0.1)])
y_test = -x_test
print(model.evaluate(x_test, y_test, batch_size=32))

# 未学習のデータで生成
predicted = model.predict(x_test, batch_size=32)

plt.plot(np.arange(0, 0.8, 0.1), [xx[0] for xx in x_test[9]])
plt.plot(np.arange(0, 0.8, 0.1), [xx[0] for xx in predicted[9]])
plt.show()
結果

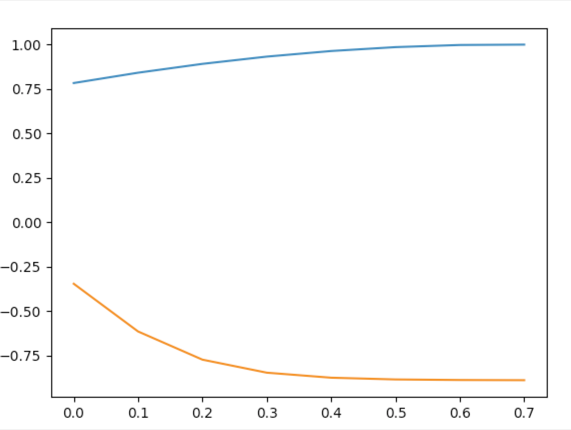
水色が入力、オレンジが学習済みモデルによる予測です。
本当は水色のグラフに -1 をかけたものが正解です、が、ちょっとずれてます。けど、雰囲気は学習してくれているみたいですね。
このように簡単に試せる環境があることはありがたいことです。(しかもとても少ないコード量で。)