Mandelbrot集合#
Mandelbrot集合とは、複素平面上の原点に対し、複素数の写像 $z \to z^2+c$を繰り返し適用したときに、zが発散しないようなcの集合です。色付けは発散するスピードによって決めます。
まずあるcに対し、発散にかかる時間を計算する関数EscapeTimeを作ります。
EscapeTime =
  Compile[{{c, _Complex}, {rmax, _Real}, {nmax, _Integer}},
   Block[{z = c, n = 1},
    While[Abs[z] <= rmax && n < nmax, z = z^2 + c; n++]; n],
   RuntimeOptions -> "Speed", CompilationTarget -> "C",
   RuntimeAttributes -> Listable, Parallelization -> True];
-
rmax:zの絶対値がこの値を超えたときに発散したと判定します -
nmax:写像の繰り返し数の上限
高速化のため絶対にCompileを使いましょう。オプションの説明は以下のとおりです。
-
RuntimeOptions -> "Speed"オーバーフローの検知を省く代わりに高速化されます。 -
CompilationTarget -> "C"コードが10倍ほど速くなります。 -
RuntimeAttributes -> Listableこの関数に複数のcのリストを渡すと、それぞれの計算結果がリストになって返ってきます。 -
Parallelization -> True複数のCPUコアを使って並列計算してくれます。
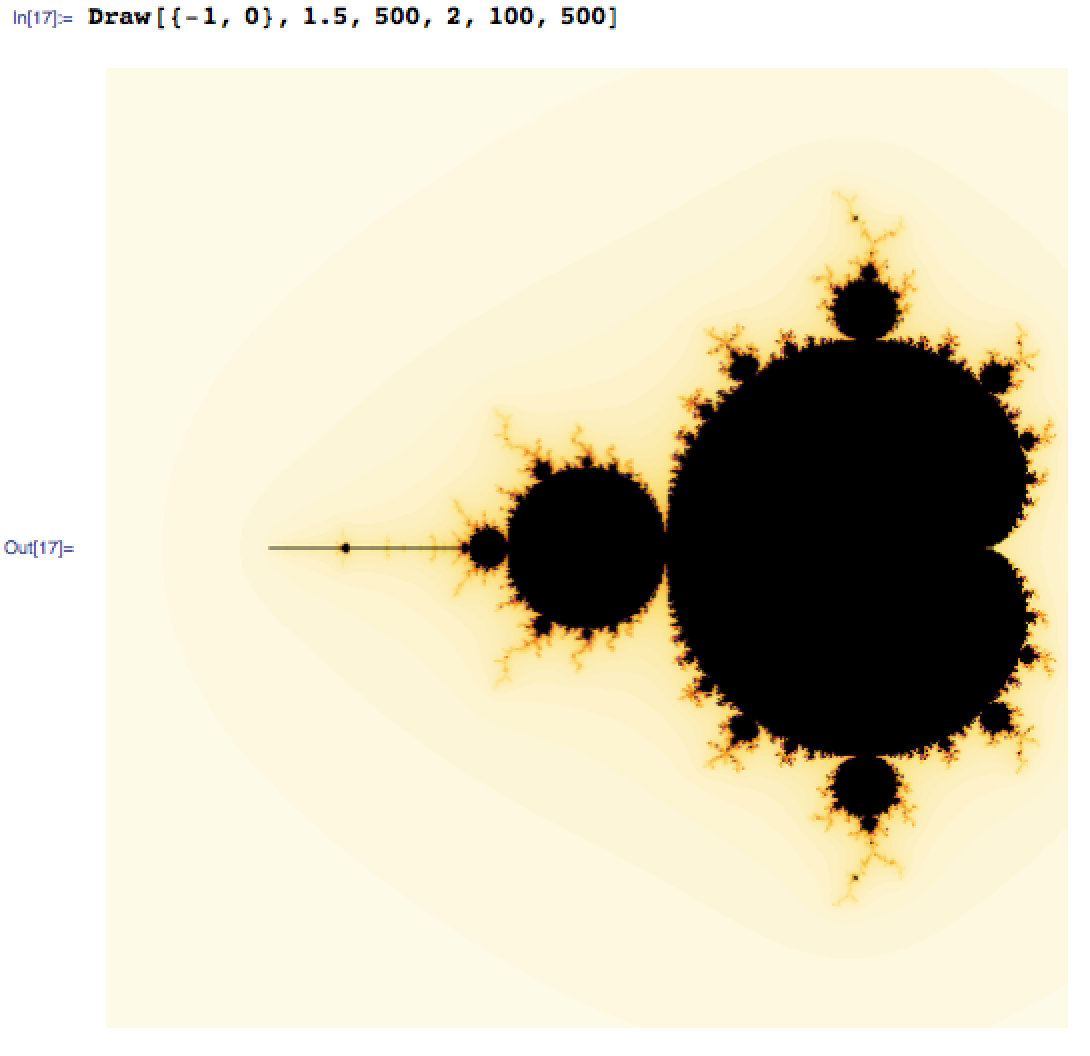
次にMandelbrot集合を描画する関数 Drawを作ります。
DensityPlotは遅いので使わないでください。配列を作成してArrayPlotで描画します。
Draw[center_, radius_, n_, rmax_, nmax_, size_] :=
  Module[
   {array = Reverse@Table[x + I y,
       {y, center[[2]] - radius, center[[2]] + radius, 2*radius/n},
       {x, center[[1]] - radius, center[[1]] + radius, 2*radius/n}]
    },
   ArrayPlot[
    EscapeTime[array, rmax, nmax],
    ColorFunction -> ColorData[{"SunsetColors", "Reverse"}],
    ImageSize -> size,
    Frame -> None,
    PlotRangeClipping -> False
    ]
   ];
-
center:描画する領域の中心座標 -
radius:描画する範囲 -
n:画像の縦横のピクセル数 -
rmax:発散の判定に使う値 -
nmax:繰り返し数の上限 -
size:画像のサイズ
実行結果###
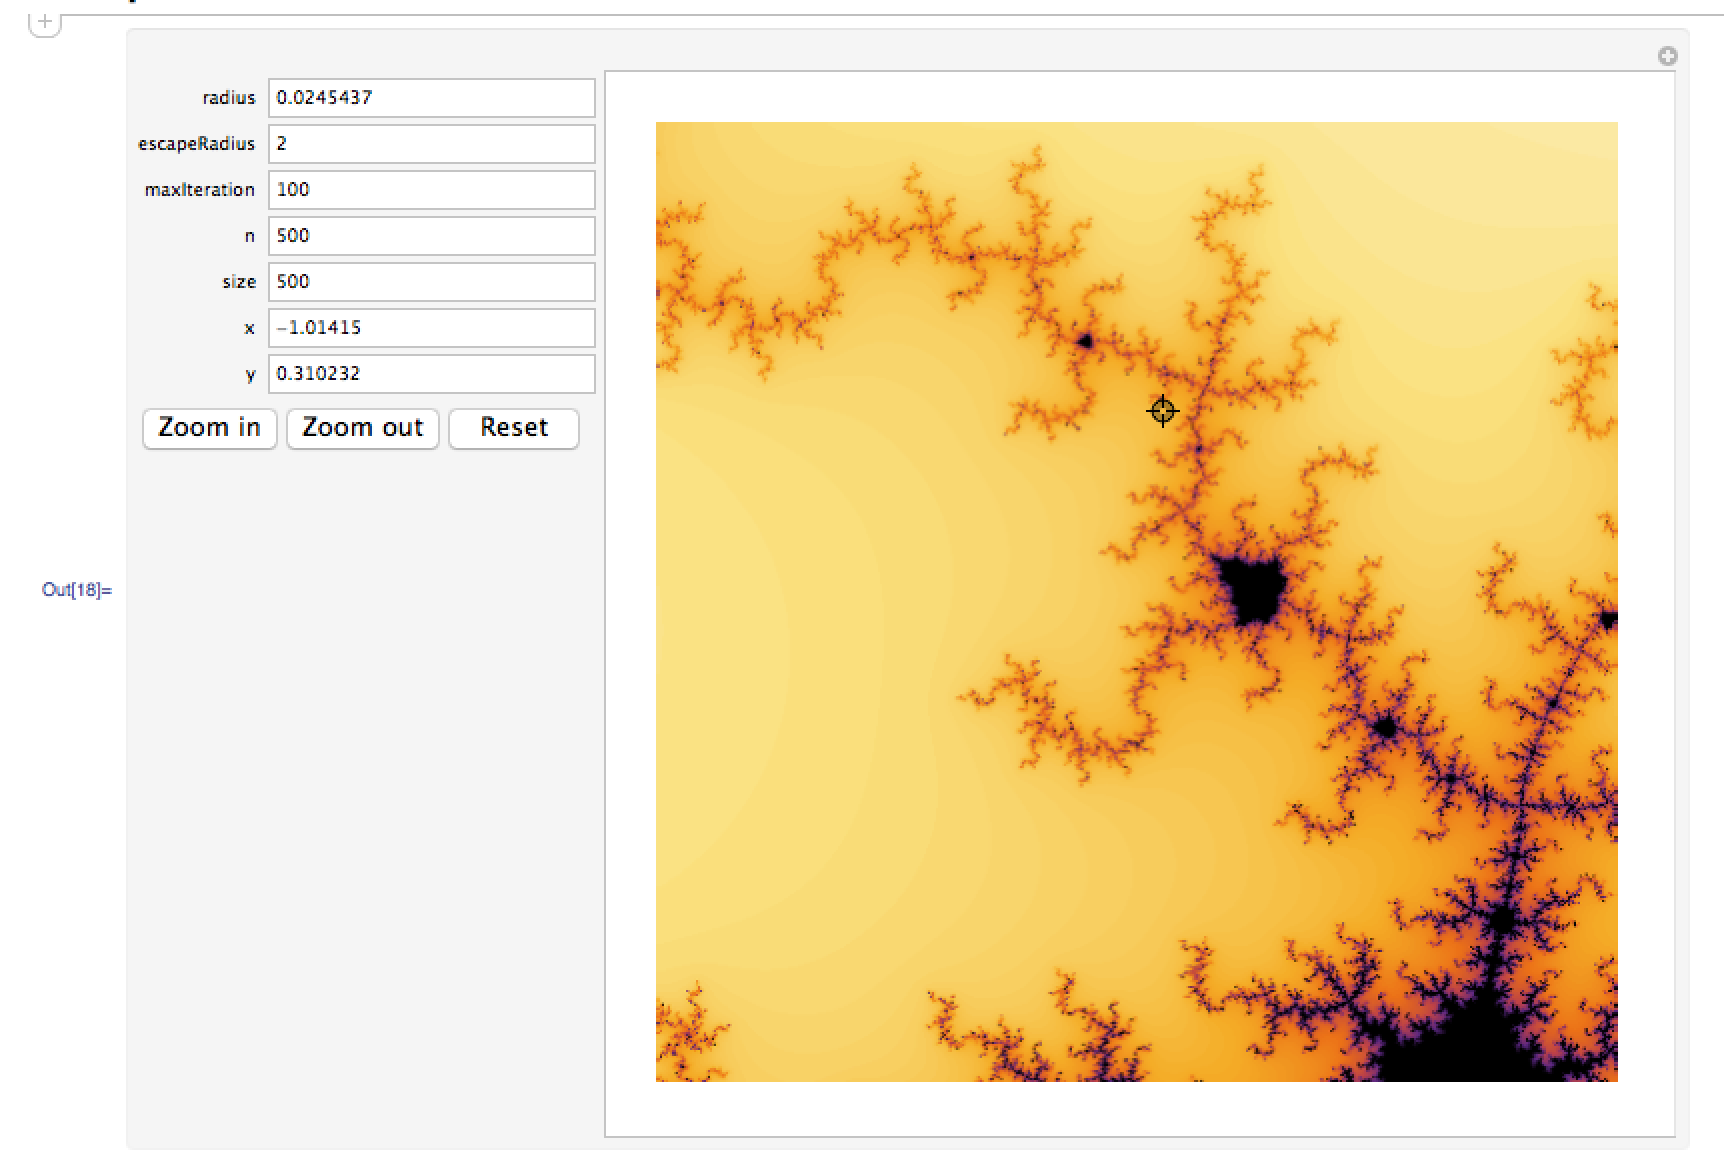
Manipulateを使った簡易GUIの作成##
ここからがMathematicaの本領発揮です。
Manipulateを使ってMandelbrotを拡大したりできる簡易GUIを作りましょう。
Manipulate[
 cent = 0.5*{n, n};
 p = {x, y};
 image = Draw[p, radius, n, escapeRadius, maxIteration, size];
 q = cent;
 image
 ,
 {radius, 0.5 \[Pi]},
 {escapeRadius, 2},
 {maxIteration, 100},
 {n, 500},
 {size, 500},
 {x, 0},
 {y, 0},
 {{q, cent}, Locator},
 Row[
  {
   Button[
    "Zoom in", ({x, y} += (q - cent)*2 radius/n; radius *= 0.25;)],
   Button["Zoom out", ({x, y} += (q - cent)*2 radius/n; radius *= 4;)],
   Button["Reset", ({x, y} = {0, 0}; radius = 0.5 \[Pi];)]
   }
  ],
 Initialization :> {
   cent = 0.5*{n, n};
 ]
実行結果###
マウスでマーカーを動かしてZoom inボタンを押すと、その点が拡大されます。
パラメータは全て直接入力できるので、低解像度でおもしろそうな場所を探して、いい点が見つかったら高解像度で描画し直すということもできます。
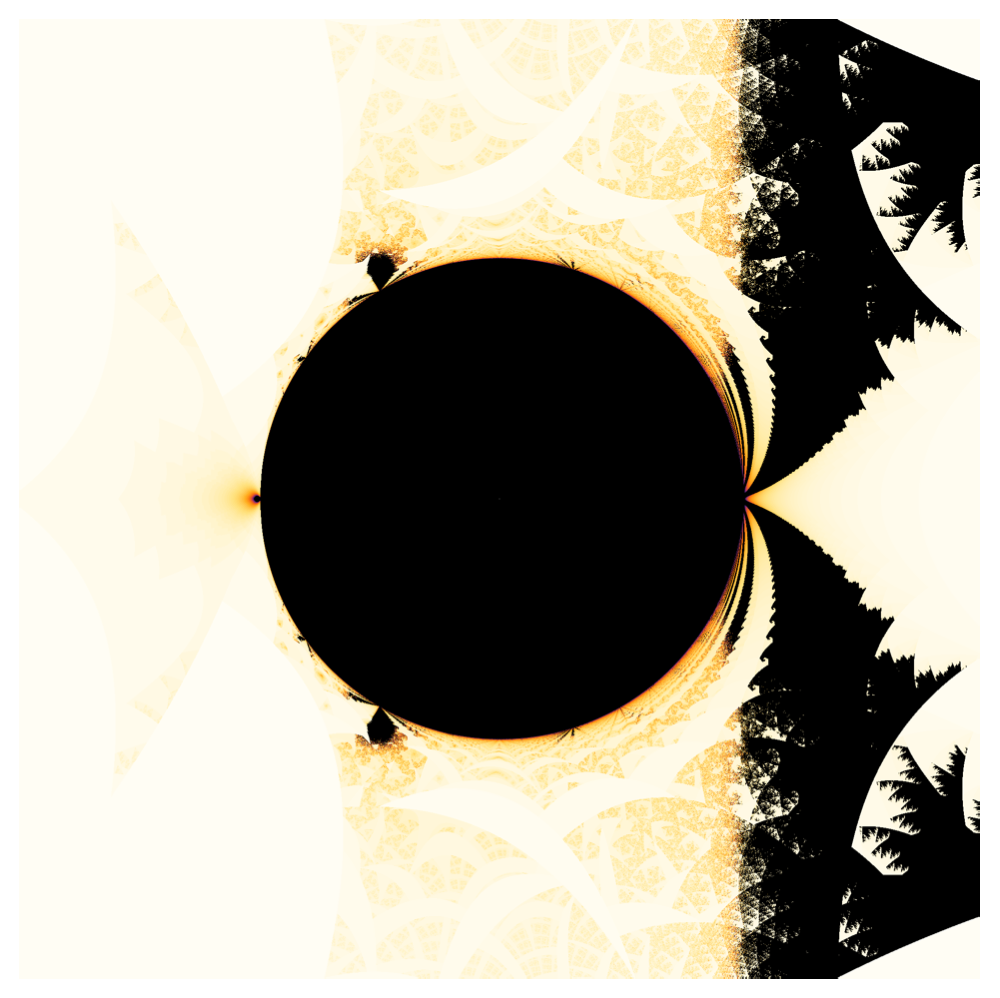
他の写像を使ったフラクタル#
ここからMathematicaの本当の本領が発揮されます。
Mandelbrot集合はは $z \to z^2+c$という写像を使いましたが、ここの式を変えると別の形のフラクタルができます。
最後に自分が見つけたいろんなフラクタルを紹介します。
ありがとうございました。
$z \to z^i + c$
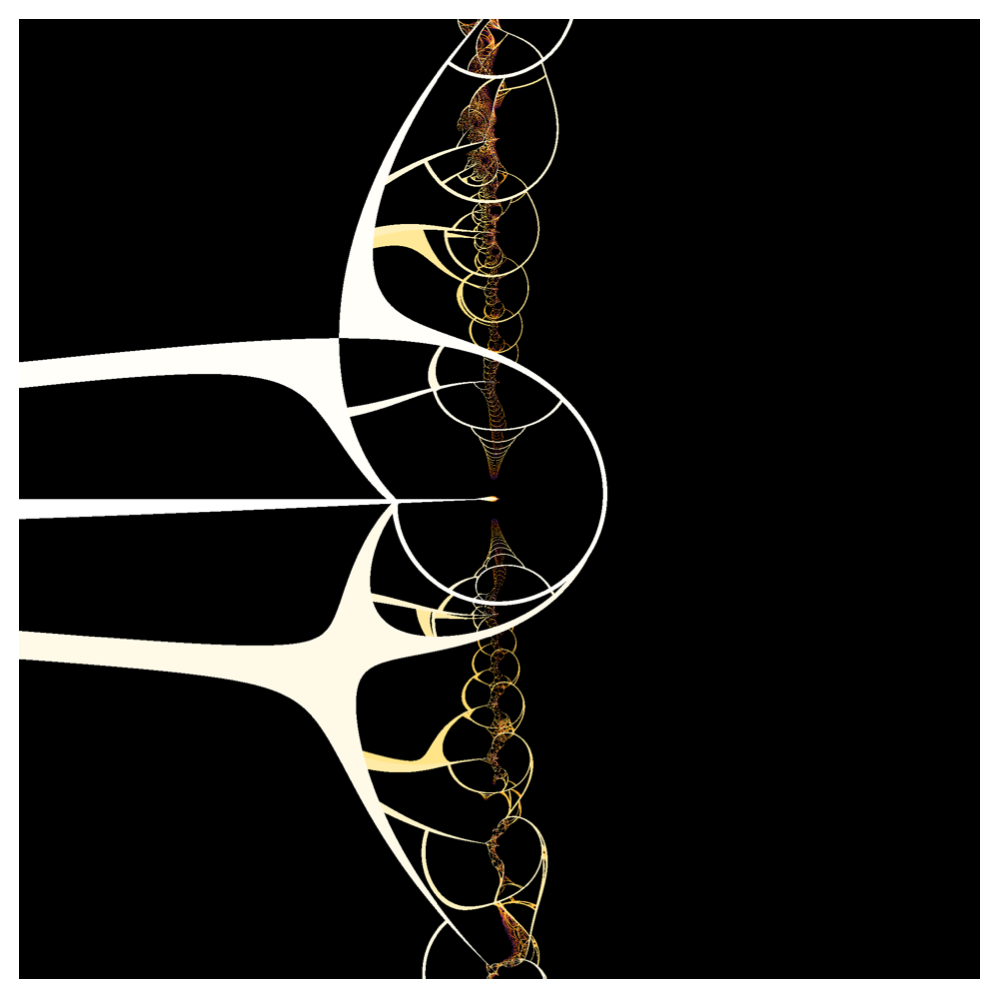
$z \to \exp(z^{-2}) + c$

$z \to z^c$