はじめに
今までPythonでのグラフ表示・作成にはpyqtgraphを使用していました。しかし、ここ3年くらいアップデートもされていないようなので、どうせならQtがサポートしているものに乗り換えたい、、、ということで、QtChartを使ってみました。
環境
- Windows 10
- Python 3.7.3
- PyQt5 5.13.1
- PyQtChart 5.13.1
インストール
$ pip install PyQt5
$ pip install PyQtChart
作成したサンプル
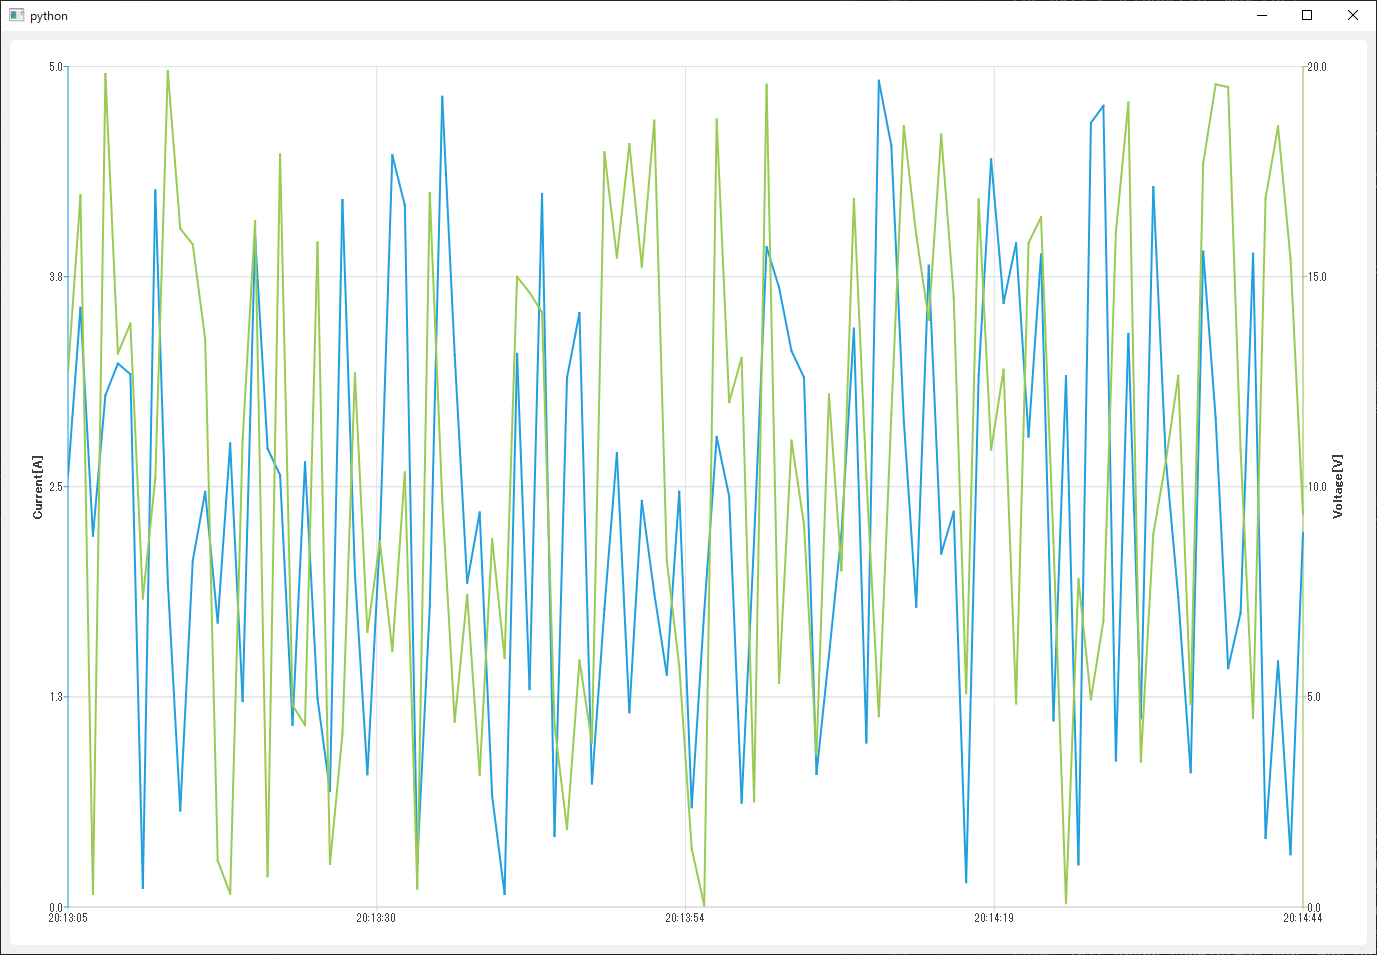
X軸が時間、Y軸が電流・電圧というものを作成しました。
ソースは以下の通り。
qchart_example.py
import random
import sys

from PyQt5.QtChart import (QChart,
                           QChartView,
                           QLineSeries,
                           QValueAxis,
                           QDateTimeAxis)
from PyQt5.QtCore import (QDateTime,
                          Qt)
from PyQt5.QtGui import QPainter
from PyQt5.QtWidgets import QApplication


app = QApplication(sys.argv)

cur_series = QLineSeries()
vol_series = QLineSeries()
now = QDateTime.currentDateTime()

# 適当なデータを作成
for i in range(100):
    cur = 5 * random.random()
    vol = 20 * random.random()
    time = now.addSecs(i).toMSecsSinceEpoch()  # QLineSeriesにappendするための処理
    cur_series.append(time, cur)
    vol_series.append(time, vol)

chart = QChart()
chart.legend().hide()
chart.addSeries(cur_series)
chart.addSeries(vol_series)

# X軸を作成
time_axis_x = QDateTimeAxis()
time_axis_x.setFormat("hh:mm:ss")
chart.addAxis(time_axis_x, Qt.AlignBottom)
cur_series.attachAxis(time_axis_x)
vol_series.attachAxis(time_axis_x)

# Y1軸を作成
cur_axis_y = QValueAxis()
cur_axis_y.setTitleText("Current[A]")
cur_axis_y.setLinePenColor(cur_series.pen().color())  # 軸とチャートの色を同じにする
cur_axis_y.setRange(0, 5)
chart.addAxis(cur_axis_y, Qt.AlignLeft)
cur_series.attachAxis(cur_axis_y)

# Y2軸を作成
vol_axis_y = QValueAxis()
vol_axis_y.setTitleText("Voltage[V]")
vol_axis_y.setLinePenColor(vol_series.pen().color())  # 軸とチャートの色を同じにする
vol_axis_y.setRange(0, 20)
chart.addAxis(vol_axis_y, Qt.AlignRight)
vol_series.attachAxis(vol_axis_y)

cur_vol_chart_view = QChartView()
cur_vol_chart_view.setChart(chart)
cur_vol_chart_view.setRenderHint(QPainter.Antialiasing)  # チャートを滑らかに表示するため
cur_vol_chart_view.show()

sys.exit(app.exec_())
参考URL
- https://doc.qt.io/qt-5/qxyseries.html#at
- https://doc.qt.io/qt-5/qvalueaxis.html#setRange
- https://doc.qt.io/qt-5/qlineseries.html
- https://doc.qt.io/qt-5/qtcharts-datetimeaxis-example.html
- https://doc.qt.io/qt-5/qdatetime.html#currentDateTime
- https://doc.qt.io/qt-5/qdatetimeaxis.html#tickCount-prop
- https://doc.qt.io/qt-5/qtcharts-multiaxis-example.html
