概要
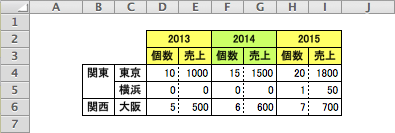
Pandasでこんな感じの表を作成してみます。
入力データ
import pandas as pd

tokyo = pd.DataFrame(data={'year':['2013','2014','2015'],
                           'cnt':[10,15,20],
                           'price':[100,100,90],},
                     columns=['year','cnt','price'])

osaka = pd.DataFrame(data={'year':['2013','2014','2015'],
                           'cnt':[5,6,7],
                           'price':[100,100,100],},
                     columns=['year','cnt','price'])

yokohama = pd.DataFrame(data={'year':['2015'],
                              'cnt':[1],
                              'price':[50],},
                        columns=['year','cnt','price'])
結果
tokyo
-----------------------
   year  cnt  price
0  2013   10    100
1  2014   15    100
2  2015   20     90

osaka
-----------------------
   year  cnt  price
0  2013    5    100
1  2014    6    100
2  2015    7    100

yokohama
-----------------------
   year  cnt  price
0  2015    1     50
サンプルデータは、とある商品の東京、大阪、横浜での3年間の売上的を想定しています。cntは個数、priceは単価です。横浜は2015年分しかデータがありません。
入力データの結合(concat)
各DataFrameに都市名をつけて縦に結合します。
# 各DataFrameに都市名を追加
tokyo['city'] = 'tokyo'
osaka['city'] = 'osaka'
yokohama['city'] = 'yokohama'

# 縦に結合
df = pd.concat([tokyo,osaka,yokohama], ignore_index=True)
結果
df
-------------------------------------
   year  cnt  price      city
0  2013   10    100     tokyo
1  2014   15    100     tokyo
2  2015   20     90     tokyo
3  2013    5    100     osaka
4  2014    6    100     osaka
5  2015    7    100     osaka
6  2015    1     50  yokohama
既存の列の情報を利用して新しい列を作成(apply)
applyメソッドで、全列や全行に対して一律の処理を行えます。
今回の例だとaxis=1を指定しているので行単位でlambda式が呼ばれています。
個数(cnt)と単価(price)をかけて、売り上げ(sales)を計算
# axis=1で、各行に対してfunctionを適用。axis='columns'でも同じ効果。
# x.cnt * x.priceの箇所が、個数*単価
df["sales"] = df.apply(lambda x:x.cnt * x.price,axis=1)
結果
df
------------------------------------------------
   year  cnt  price      city  sales
0  2013   10    100     tokyo   1000
1  2014   15    100     tokyo   1500
2  2015   20     90     tokyo   1800
3  2013    5    100     osaka    500
4  2014    6    100     osaka    600
5  2015    7    100     osaka    700
6  2015    1     50  yokohama     50
都市(city)名から、関東・関西エリア(area)を判断
# 'west' if x.city == 'osaka' else 'east'は三項演算です。
df["area"] = df.apply(lambda x:'west' if x.city == 'osaka' else 'east',axis=1)
結果
df
------------------------------------------------
   year  cnt  price      city  sales  area
0  2013   10    100     tokyo   1000  east
1  2014   15    100     tokyo   1500  east
2  2015   20     90     tokyo   1800  east
3  2013    5    100     osaka    500  west
4  2014    6    100     osaka    600  west
5  2015    7    100     osaka    700  west
6  2015    1     50  yokohama     50  east
都市と年度の表を作成(pivot_table)
各都市の各年度の売上を一覧表にします。Pandasはpivot_tableで自動的に編集してくれるのですが、引数が複雑で慣れが必要です。今回はこのページを参考にしました。
# areaとcityを横軸に、yearを縦軸にして、cntとsalesの表を作る。
# fill_valueは、データの欠損部分を0埋めしている。
df2 = pd.pivot_table(df,
                     index=['area','city'],
                     columns=['year'],
                     values=['cnt','sales'],
                     fill_value=0)
結果
df2
------------------------------------------------
               cnt           sales
year          2013 2014 2015  2013  2014  2015
area city
east tokyo      10   15   20  1000  1500  1800
     yokohama    0    0    1     0     0    50
west osaka       5    6    7   500   600   700
上記はPythonの出力結果ですが、もうちょっとわかりやすくするとこんな感じの状態になっています。
              |  cnt           | sales             <カラム1階層目(名前無し)
              |================|===================
year          | 2013 2014 2015 | 2013  2014  2015  <カラム2階層目(名前はyear)
==============|================|===================
east|tokyo    |   10   15   20 | 1000  1500  1800
    |yokohama |    0    0    1 |    0     0    50
west|osaka    |    5    6    7 |  500   600   700
==============|================|===================
area|city <<Indexも2階層になっている。名前はareaとcity。
Pivot結果のカラムの順序を変更(swaplevel)
かなりアウトプットに近づいたのですが、カラムを「年度」>「個数、売上」の順にしたいので、swaplevelで編集します。(pivotだけでできる方法を知っていたら教えてください。)
カラムの2行を入れ替える
# 第1引数の0は、columの0行目をさす
# 第2引数の1は、columの1行目をさす
df2=df2.swaplevel(0,1, axis=1)
結果(yearが先頭に移動しています)
df2
------------------------------------------------
year          2013 2014 2015  2013  2014  2015
               cnt  cnt  cnt sales sales sales
area city
east tokyo      10   15   20  1000  1500  1800
     yokohama    0    0    1     0     0    50
west osaka       5    6    7   500   600   700
年度順に並べかえる
df3=df2[['2013','2014','2015']]
結果
df3
------------------------------------------------
year          2013       2014       2015
               cnt sales  cnt sales  cnt sales
area city
east tokyo      10  1000   15  1500   20  1800
     yokohama    0     0    0     0    1    50
west osaka       5   500    6   600    7   700
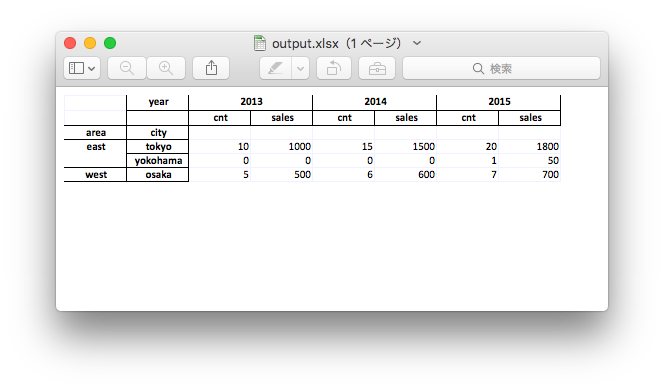
エクセルに出力
ここまでで欲しいアウトプットが作れたので、エクセルに出力します。
# pip install openpyxl
writer = pd.ExcelWriter('output.xlsx')
df3.to_excel(writer,'Sheet1')
writer.save()
あとは罫線を引いたり色をつけたりして完了です。
openpyxlでもできそうですが、今回はエクセルで手動ですませました。